
|
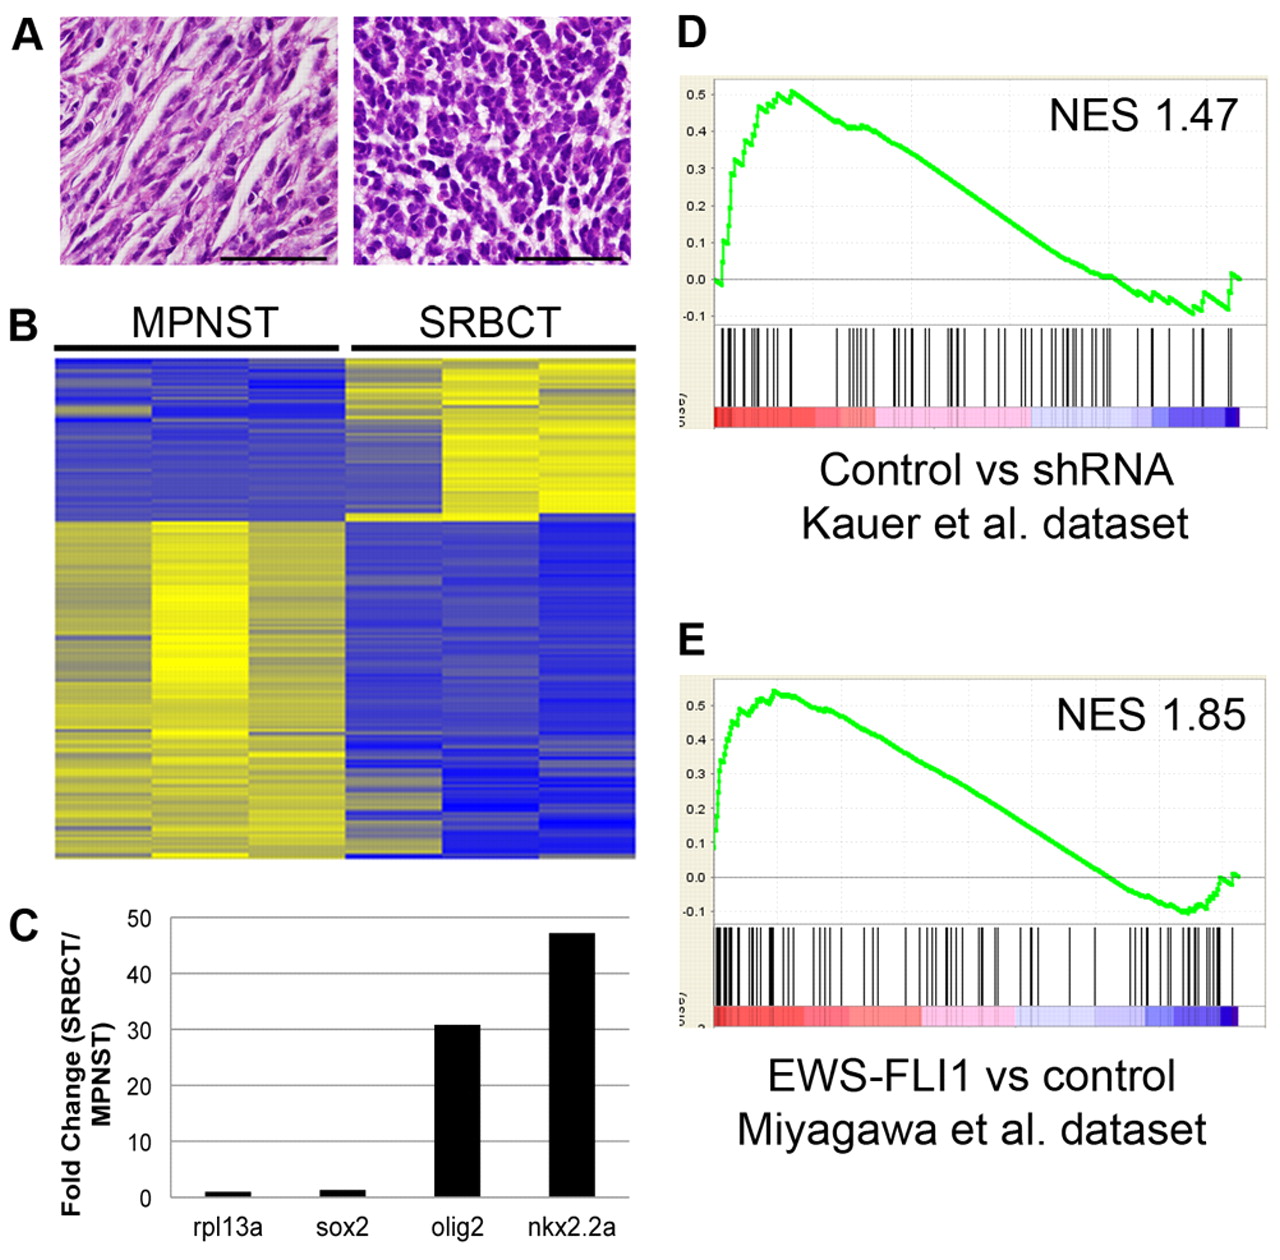
Fig. 3
Gene expression in zebrafish SRBCTs is distinct from MPNSTs and similar to human EWS-FLI1 gene expression data. (A) Histology of representative zebrafish MPNST (left) and SRBCT (right) that were used for microarray analysis. Scale bars: 50 μm. (B) Heat map of 421 probes that exhibited differential expression between MPNSTs and SRBCTs. Yellow, high expression; blue; low expression. (C) Quantitative RT-PCR of selected SRBCT upregulated genes. (D,E) GSEA using human homologs of zebrafish genes shown in B compared with human gene expression data from (D) stable knockdown of EWS-FLI1 (red, higher expression in A673 Ewing’s cell line; blue, higher expression following EWS-FLI1 knockdown in A673 cells) or (E) inducible expression of EWS-FLI1 in a bone-marrow-derived stromal cell line (red, higher expression in EWS-FLI1 expressing cells; blue, higher expression in control cells).