
Image
|
Figure Caption
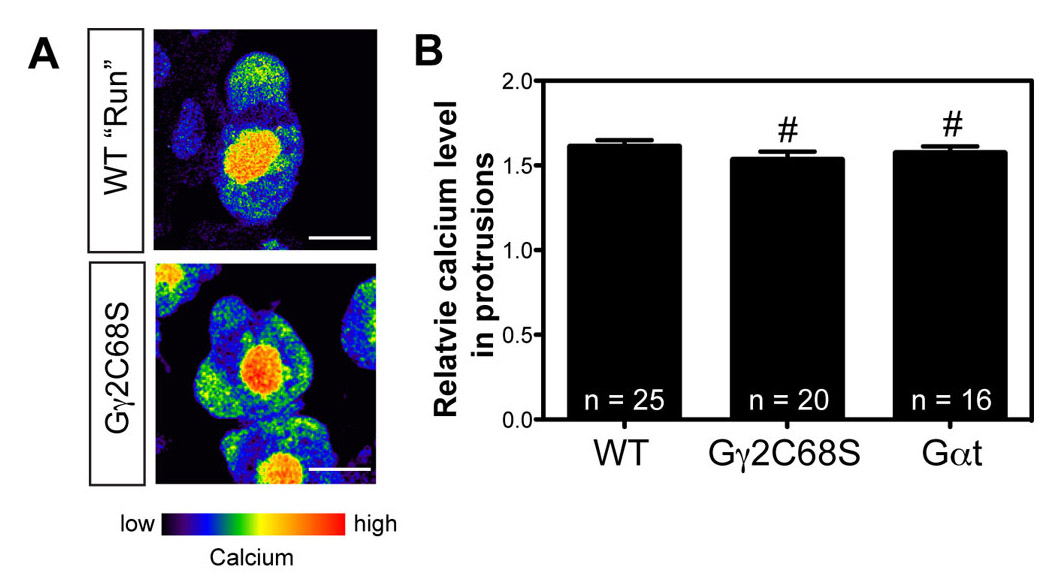
Fig. S4 Ca2+ levels in the protrusions are normal in PGCs expressing Gαt or Gγ2C68S. (A) Pseudocolor images from confocal time-lapse movies showing wild-type and Gγ2C68S-expressing PGCs loaded with the Ca2+-sensitive fluorescent dye Oregon Green. Images are shown in the intensity-modulated display mode. The bar illustrates the range of relative Ca2+ levels (low in blue to high in red). Scale bars: 10 μm. (B) Relative Ca2+ levels in the protrusions of wild-type PGCs, and in those of PGCs expressing either Gαt or Gγ2C68S. #P>0.05 versus control. The number of PGC analyzed is indicated.
Acknowledgments
This image is the copyrighted work of the attributed author or publisher, and
ZFIN has permission only to display this image to its users.
Additional permissions should be obtained from the applicable author or publisher of the image.
Full text @ Development