
|
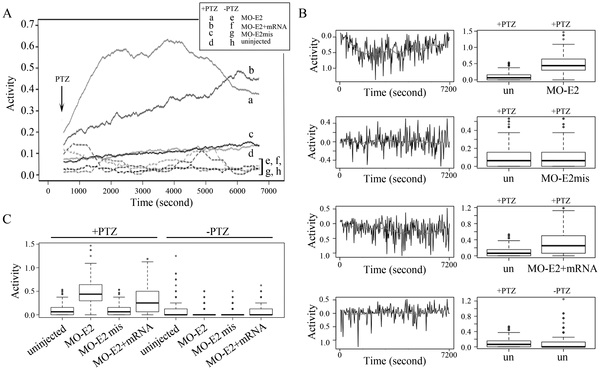
Fig. 5 Synergistic PTZ induction of seizure-like behavior in lgi1b morphants. (A) Longitudinal plot of average activity of 72 hpf embryos over a 2 hour period using Viewpoint modeling software time series plots and a custom smoothing algorithm described by Teng et al (2010). Dotted lines depict the four classes of fish without PTZ treatment (e, f, g, h). Solid lines depict morphants and controls according to key (above). In the absence of PTZ (dotted lines) fish activity (n = 96 for each group) is relatively low in the 2 ng morphants and wild type fish. Upon treatment with PTZ (solid lines) average activity increases significantly in MO-E2 morphants (a) but not in the mismatch morphants (c) or wild type fish (d). Morphants co-injected with rescue lgi1b mRNA show a significant reduction in activity (b) compared with the MO-E3 morphants. (B) Box plots generated in R statistical software showing the distribution of average fish activity over time for different experimental conditions as shown. (C) Comparison of the longitudinal differences in mean values between experimental groups. The red trace follows the moving averages longitudinally (left). Box plots of the same data are shown (right).