
|
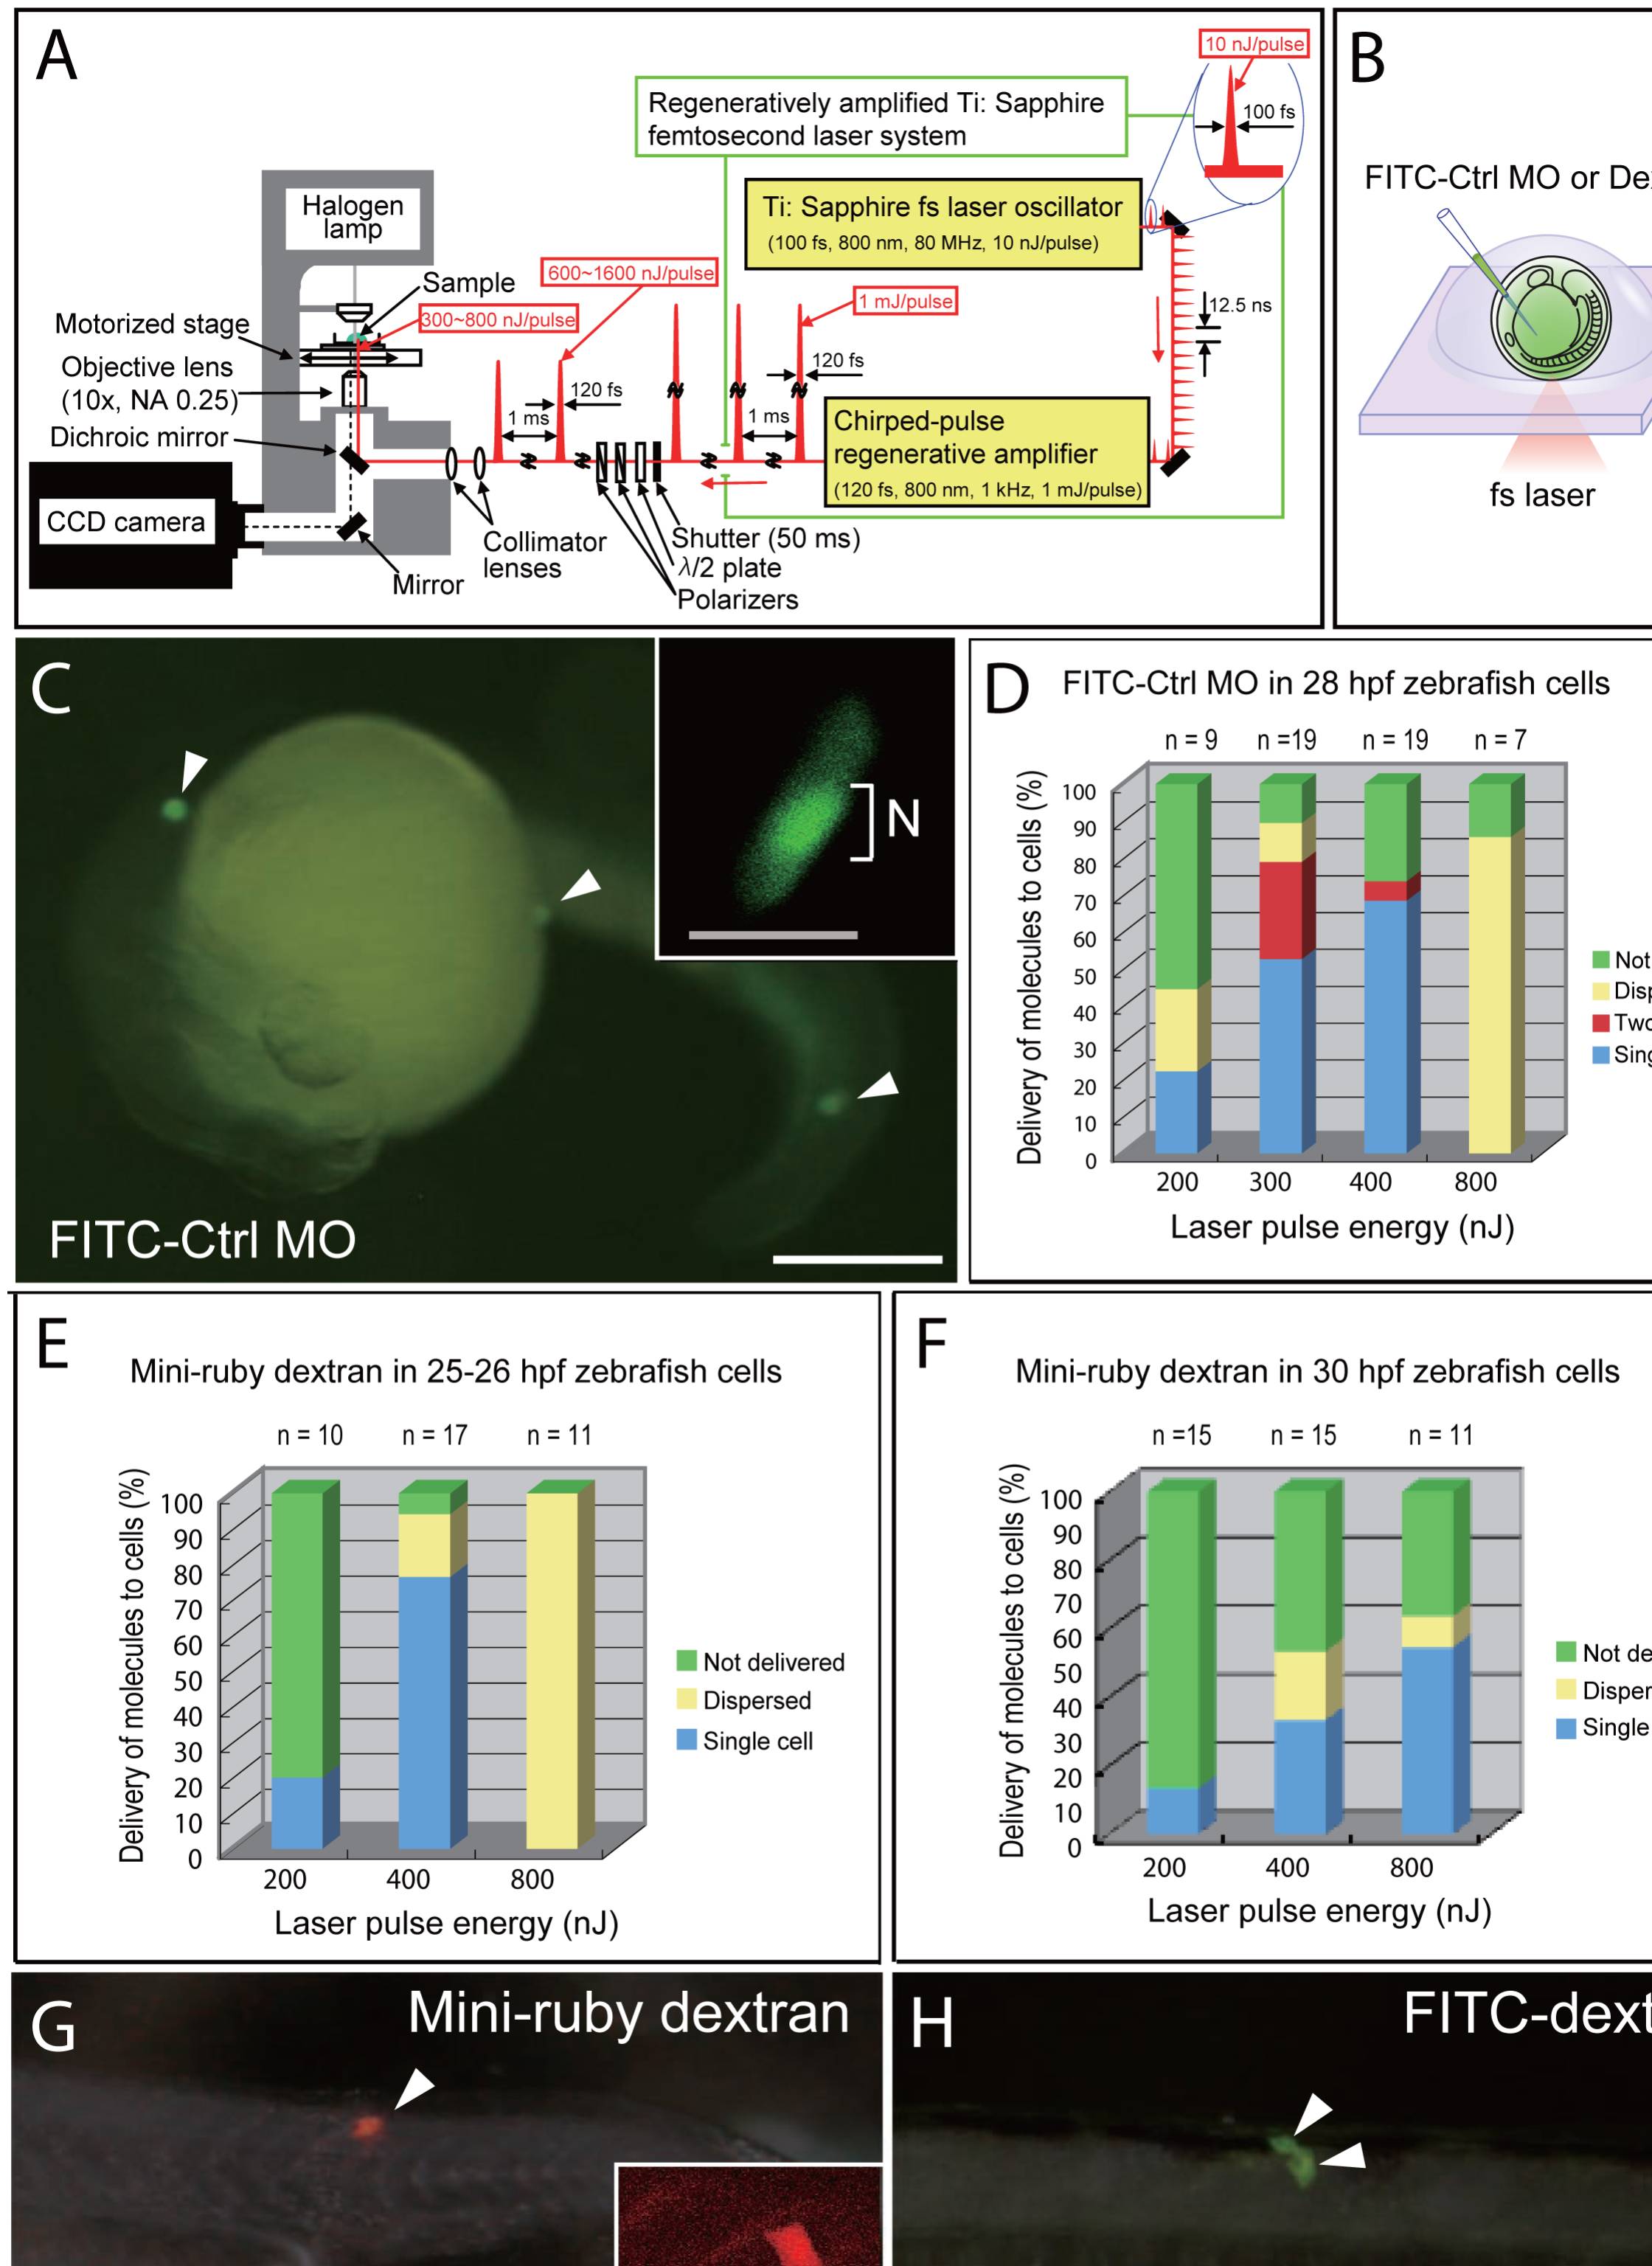
Fig. 1 NIR-fs Laser Photoporation of MOs or dextran into single cells of zebrafish embryos.
(A) Experimental setup for targeted introduction of biomolecules with femtosecond laser irradiation. Specifications are described in Materials and Methods. (B) Schematic representation of targeted delivery to single cells of zebrafish embryos. FITC-MO, FITC-dextran, or mini-ruby dextran was injected into the chorion cavity of anesthetized embryos mounted in methylcellulose solution. The femtosecond laser pulse train was focused on the surface of single cells. (C) FITC-MO was detected in three targeted single cells (arrowheads). Inset: FITC-MO was localized to the nucleus (N) of the targeted cell. (D) Success rate of delivery of FITC-MO into 28-hpf zebrafish epithelial cells. (E, F) Success rate of delivery of mini-ruby dextran into 25- to 26-hpf (E) and 30-hpf (F) zebrafish epithelial cells. (G) Mini-ruby dextran was detected in a single targeted cell (arrowhead) of a 25- to 26-hpf zebrafish embryo. Inset: Magnification of the targeted cell. (H) At 24 h after introduction of FITC-dextran, FITC fluorescence was detected in newly divided cells (arrowheads). n, number of individual experiments. Scale bars: 250 μm (C, G); 50 μm (insets in C, G); 100 μm (H).