
|
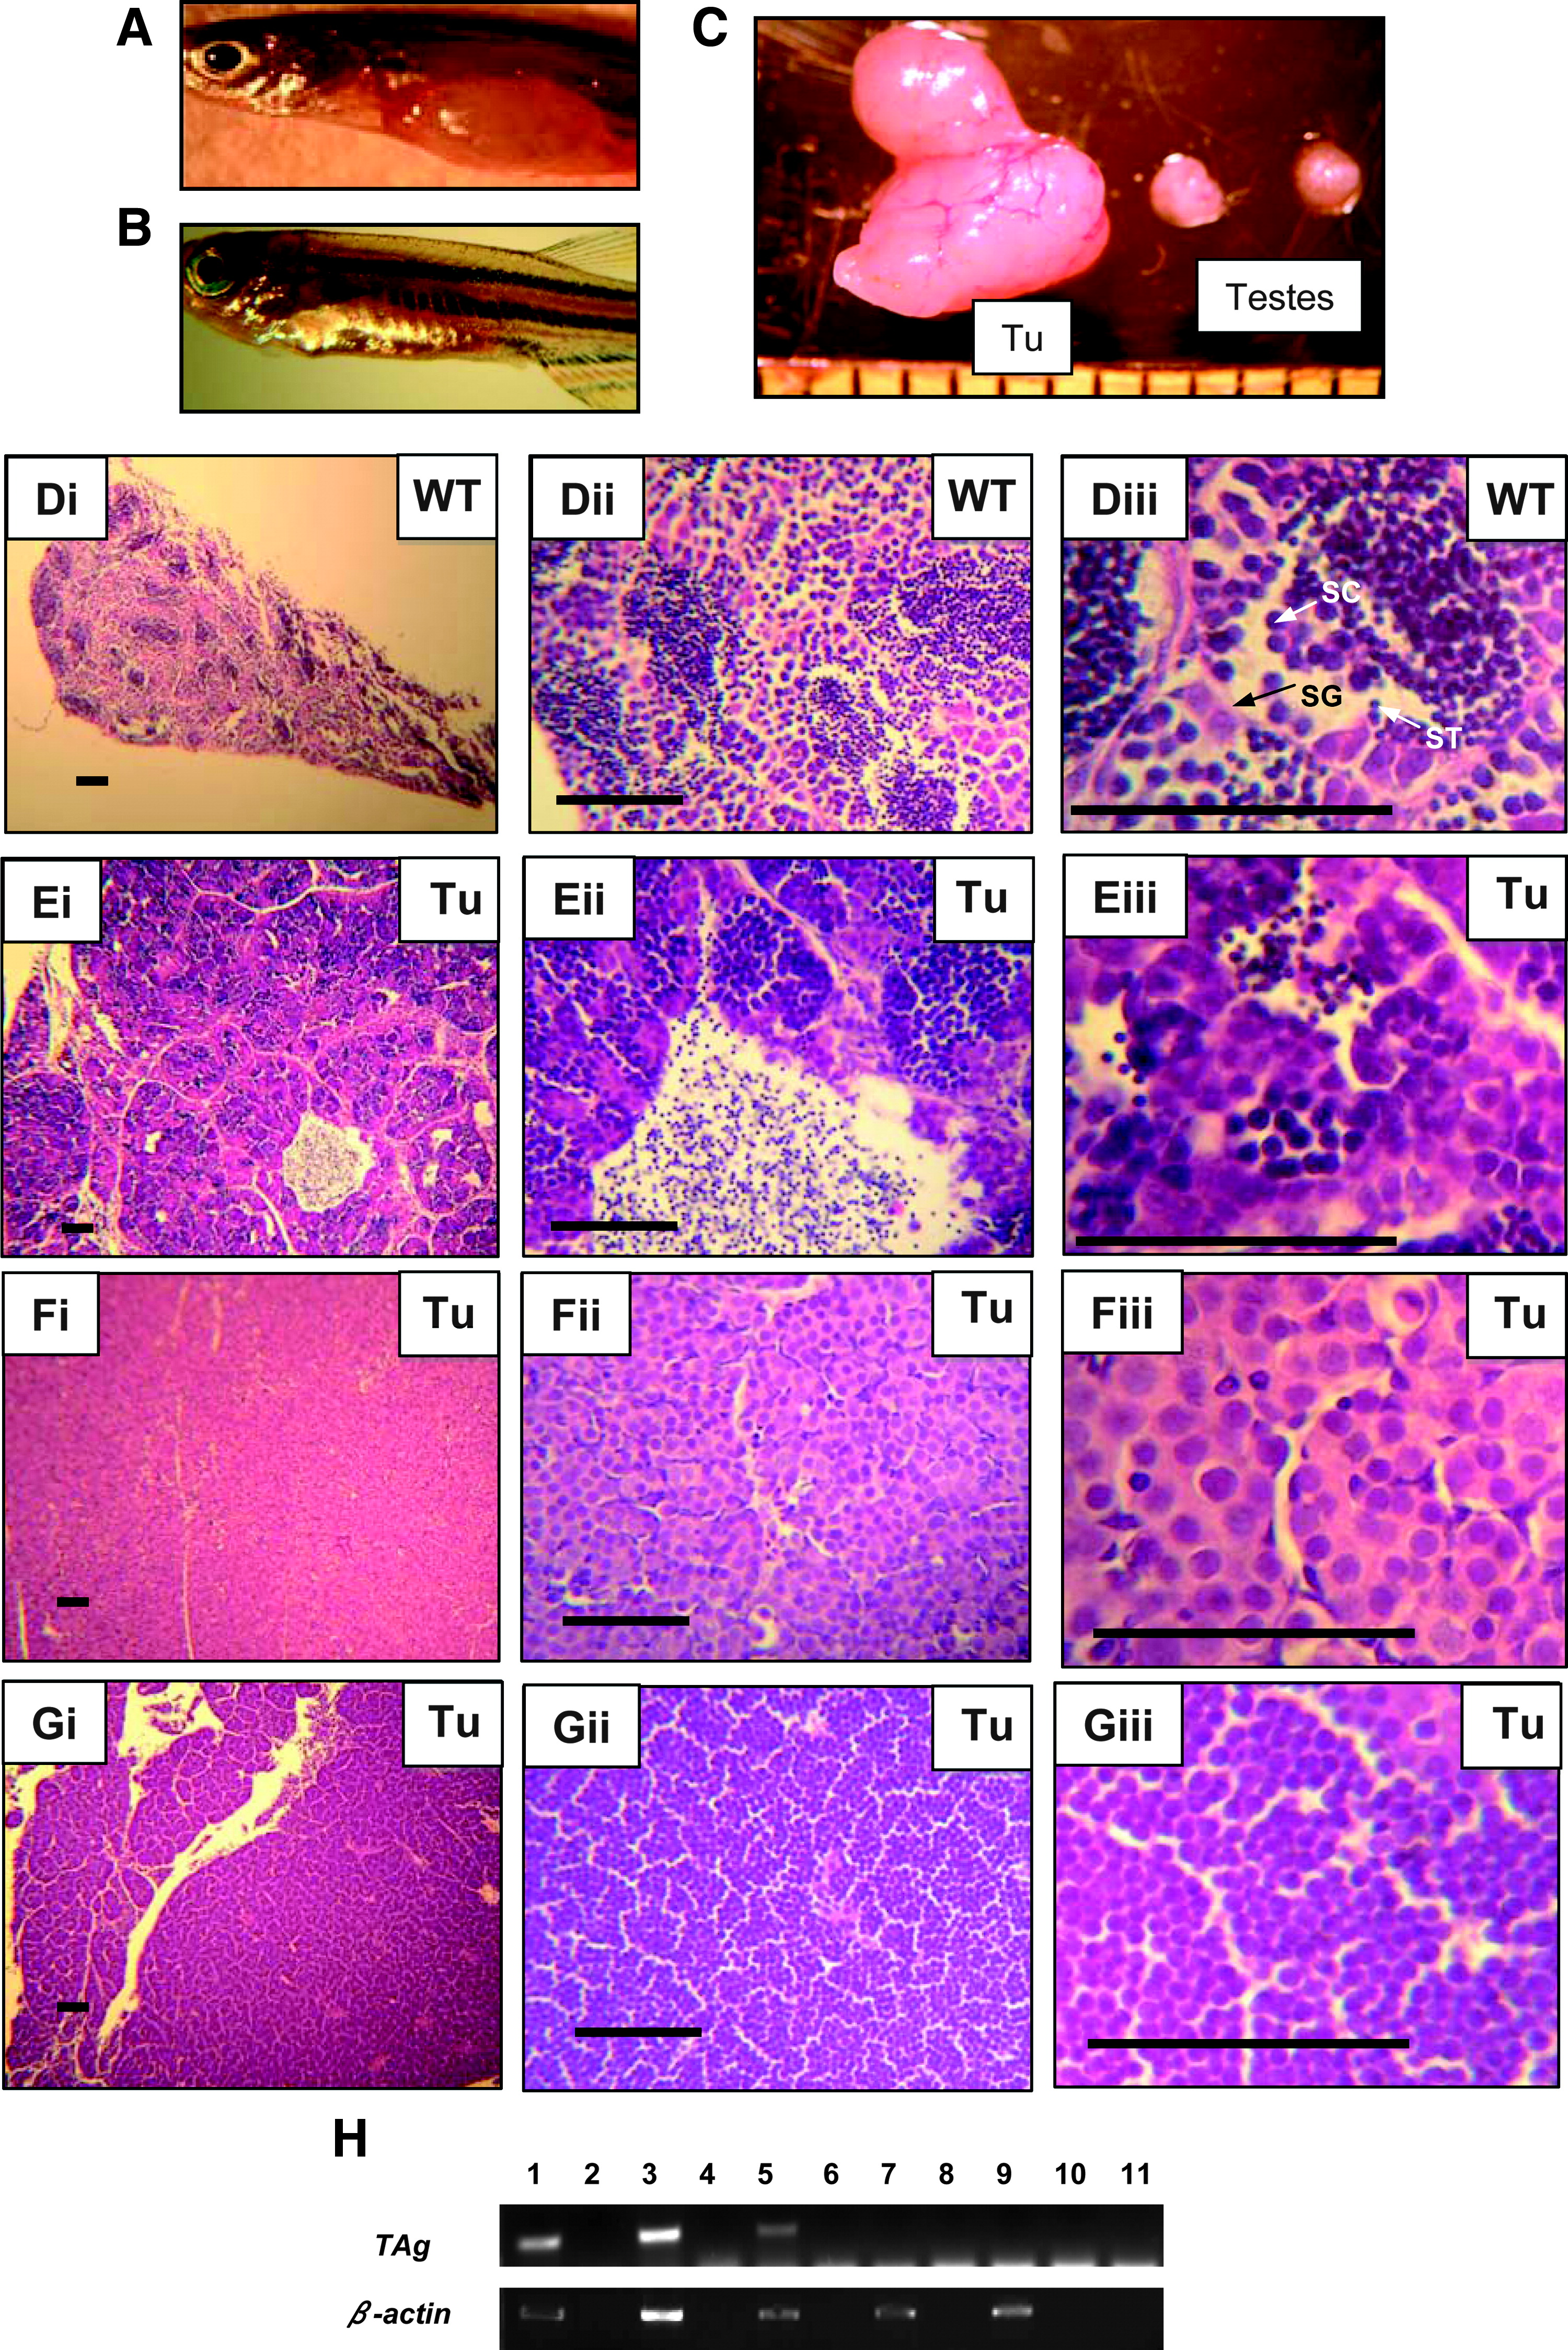
Fig. 2 Characterization of abdominal tumors. (A) Gross photo of flck:TAg zebrafish with abdominal tumor. (B) WT male zebrafish for comparison (C) testicular germ cell tumor (Tu) compared to WT testes. Size scale is in mm. (Di–Diii) Hematoxylin and eosin-stained testis from WT fish at low, medium, and high power, respectively. Scale bar is 50 μm in all photos. Spermatogonia (SG), spermatocytes (SC), and spermatids (ST) are indicated in (Diii). (Ei–Eiii) TGCT from flck:TAg fish T32(25), same magnifications as above. Note wide spectrum of different cell sizes and morphology. (Fi–Fiii) TGCT from flck:TAg fish T24 (10), same magnifications as above. Note the uniform population of cells with abundant eosinophilic cytoplasm and a low nuclear-to-cytoplasmic ratio, consistent with spermatogonial cells. (Gi–Giii) TGCT from flck:TAg fish T24(4), same magnifications as above. Note the uniform population of basophilic cells with a high nuclear-to-cytoplasmic ratio, consistent with spermatocytes. (H) Reverse transcription-polymerase chain reaction assay for TAg expression. Lanes 1–4, TGCT from two independent Tg(flck:TAg) fish; lanes 5 and 6, testes from a clinically healthy Tg(flck:TAg) fish without TGCT; lanes 7 and 8, WT testes; lanes 9 and 10, gill from clinically healthy Tg(flck:TAg) fish; lane 11, dH2O. Reverse transcriptase was not added to the cDNA reactions in lanes 2, 4, 6, 8, and 10. Polymerase chain reaction amplification for TAg or β-actin is shown. TGCTs, testicular germ cell tumors.