
|
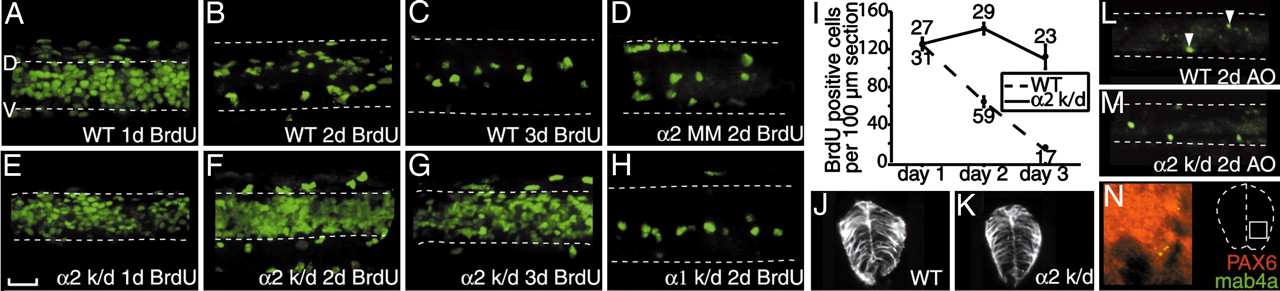
Fig. 4
Antibody staining reveals an increase in BrdU-incorporated cells in α2 knockdown fish. Shown are lateral views of BrdU-incorporated cells in whole-mount spinal cord sections of wild-type fish at 1, 2, and 3 days in development (A–C), GlyR α2 mismatch (α2 MM) at 2 days in development (D), GlyR α2 knockdown (α2 k/d) fish at 1, 2, and 3 days in development (E–G), and GlyR α1 knockdown (α1 k/d) fish at 2 days in development (H). Dotted lines demarcate dorsal (D) and ventral (V) limits of the spinal cord. (Scale bar: 25 μm.) (I) Graph of average number of BrdU-labeled cells in a 100-μm segment of spinal cord between days 1 and 3 in development for wild-type (open circles, broken line) and GlyR α2 knockdown (α2 k/d; solid circles, solid line) fish. The number of BrdU-labeled neurons in wild-type fish was significantly different from GlyR α2 knockdown fish at day 2 (P = 10-7) and day 3 (P = 10-7) but not day 1 (P = 0.9). The n values from which means were taken are illustrated below (for wild type) and above (for GlyR α2 k/d) each circle in G. (J and K) zrf-1 antibody labeling of radial glia in sections of 2-day wild-type (J) and α2 knockdown (K; α2 k/d) larvae. (L and M) Lateral view of acridine orange-labeled apoptotic cells (arrowheads) in wild-type (L) and GlyR α2 knockdown (M; α2 k/d) fish. (N Left) mAb4a (green) and PAX6 (red) costaining in a hemisomite cross section of the embryo spinal cord. (N Right) Diagram depicts spinal region imaged.