
Image
|
Figure Caption
Fig. 2
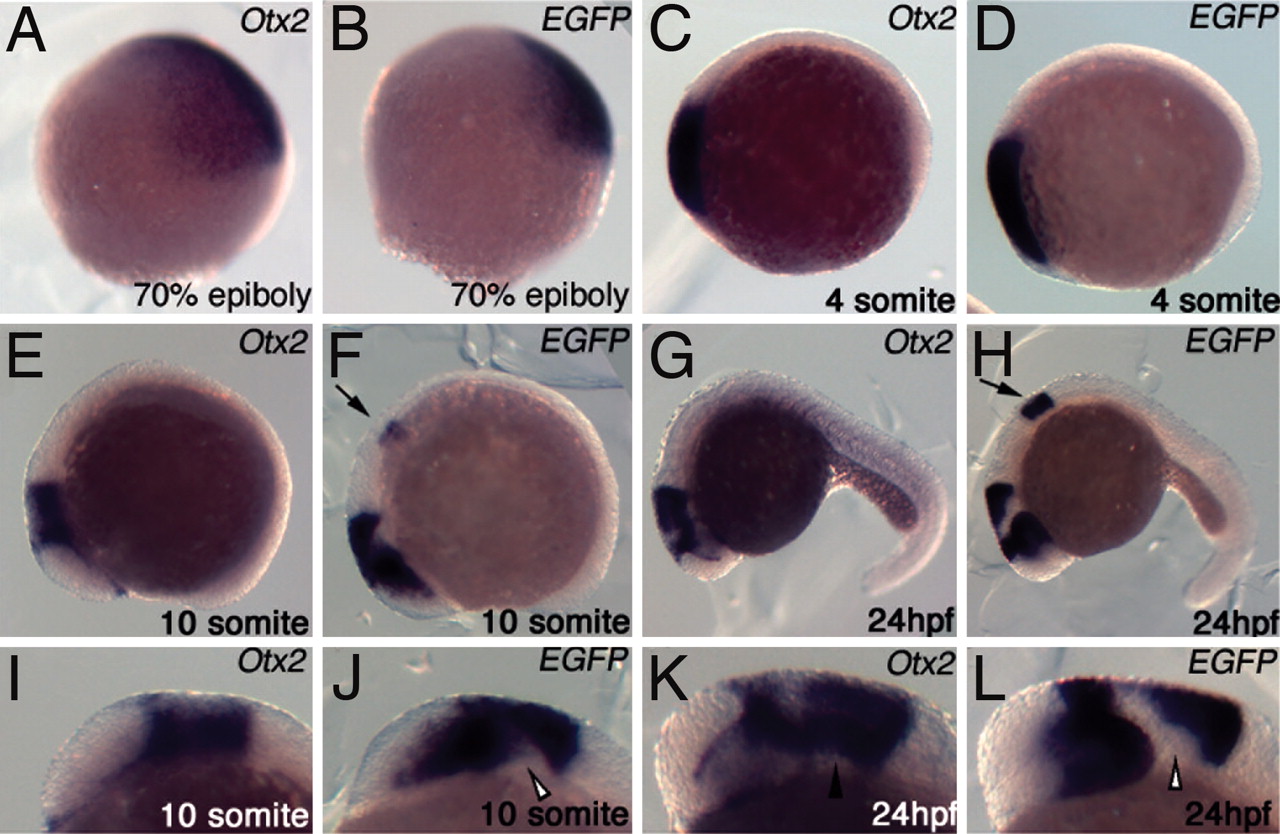
Activity pattern of zebrafish FM enhancer during zebrafish anterior neuroectoderm development. EGFP mRNA expression driven by zfFM in a typical permanent transgenic zebrafish line (B, D, F, H, J, and L) is compared with endogenous Otx2 mRNA expression (A, C, E, G, I, and K). All images are lateral views. (I–L) are views of head region in (E–H) at high magnification. Arrows in F and H indicate ectopic expression in hindbrain. A solid arrowhead in K indicates the presence of the endogenous Otx2 expression and open arrowheads in J and L indicate the absence of the transgenic EGFP expression in tegmentum.
Figure Data
Acknowledgments
This image is the copyrighted work of the attributed author or publisher, and
ZFIN has permission only to display this image to its users.
Additional permissions should be obtained from the applicable author or publisher of the image.
Full text @ Proc. Natl. Acad. Sci. USA