
|
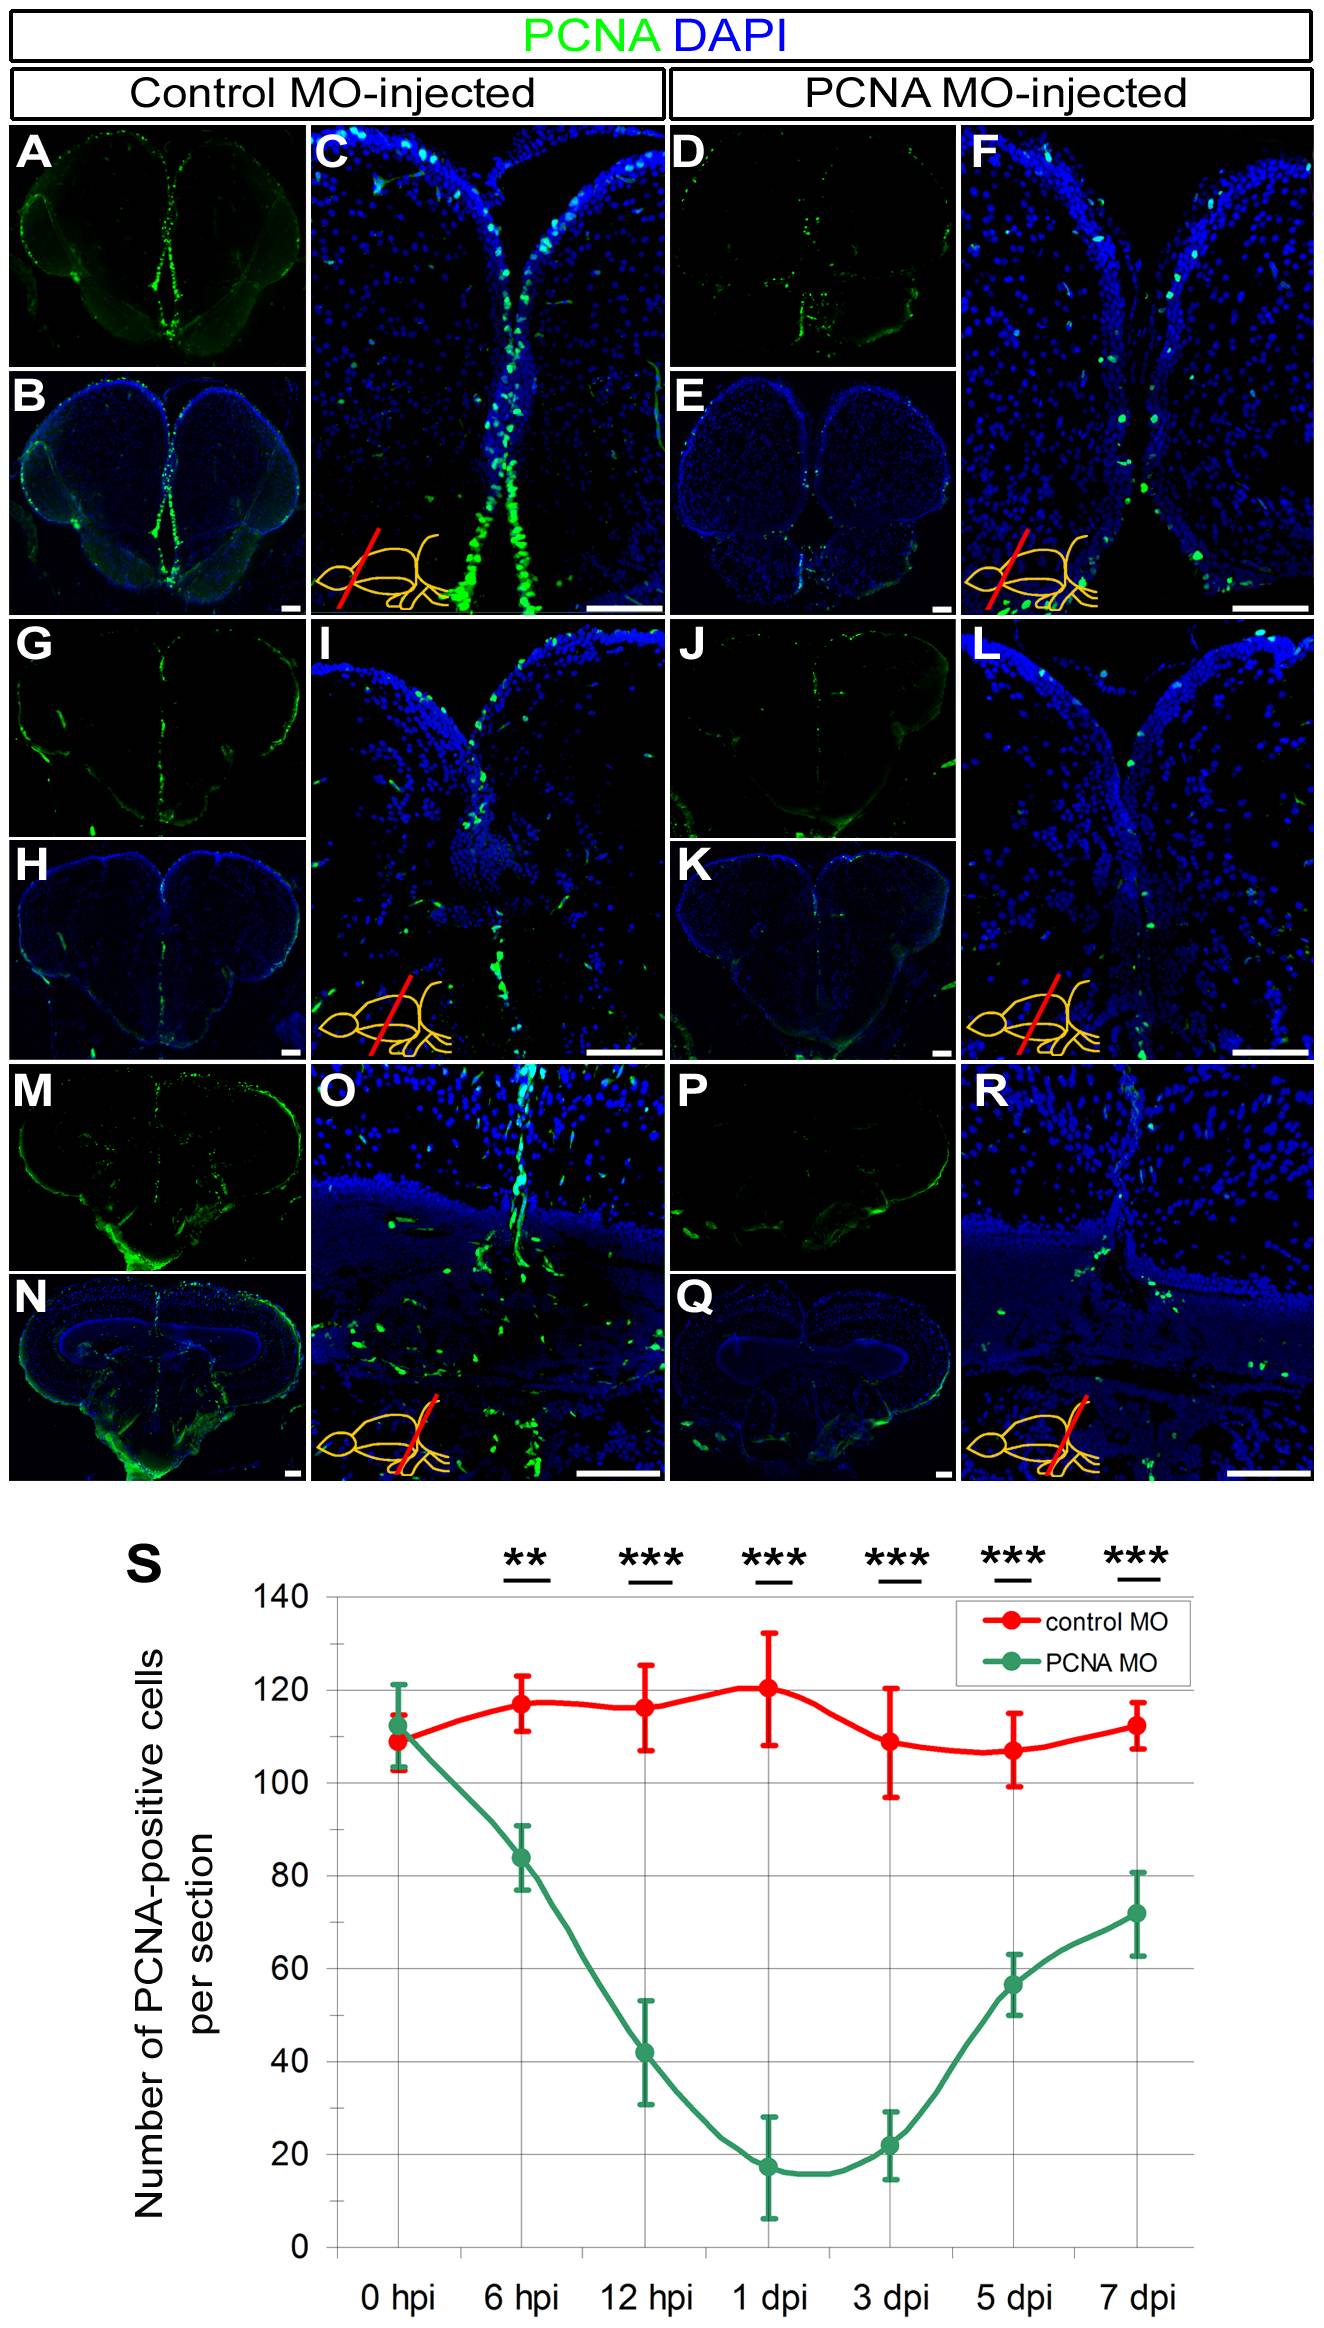
Fig. 4 Knocking-down PCNA as an endogenous gene using CVMI.
(A) PCNA immunohistochemistry (IHC) on rostral telencephalon of control morpholino-injected (ctrl-MO) brains. (B) DAPI counterstaining on A. (C) High magnification image of medial ventricular region of B. (D) PCNA IHC on rostral telencephalon of PCNA morpholino-injected (PCNA-MO) brains. (E) DAPI counterstaining on D. (F) High magnification image of medial ventricular region of E. (G) PCNA IHC on rostral telencephalon of ctrl-MO brains. (H) DAPI counterstaining on G. (I) High magnification image of medial ventricular region of H. (J) PCNA IHC on telencephalon of PCNA-MO brains on a more caudal level. (K) DAPI counterstaining on J. (L) High magnification image of medial ventricular region of K. (M) PCNA IHC on rostral optic tectum of ctrl-MO brains. (N) DAPI counterstaining on M. (O) High magnification image of dorsal region of N. (P) PCNA IHC on rostral optic tectum of PCNA-MO brains. (Q) DAPI counterstaining on P. (R) High magnification image of dorsal region of Q. (S) Graph depicts the average number of PCNA-positive cells in PCNA antisense morpholino-injected brains (green line) over a time course relative to control morpholino-injected brains (red line). Scale bars 50 μm. hpi: hours post injection, dpi: days post injection. N = 3 adult fish for each time point.