
|
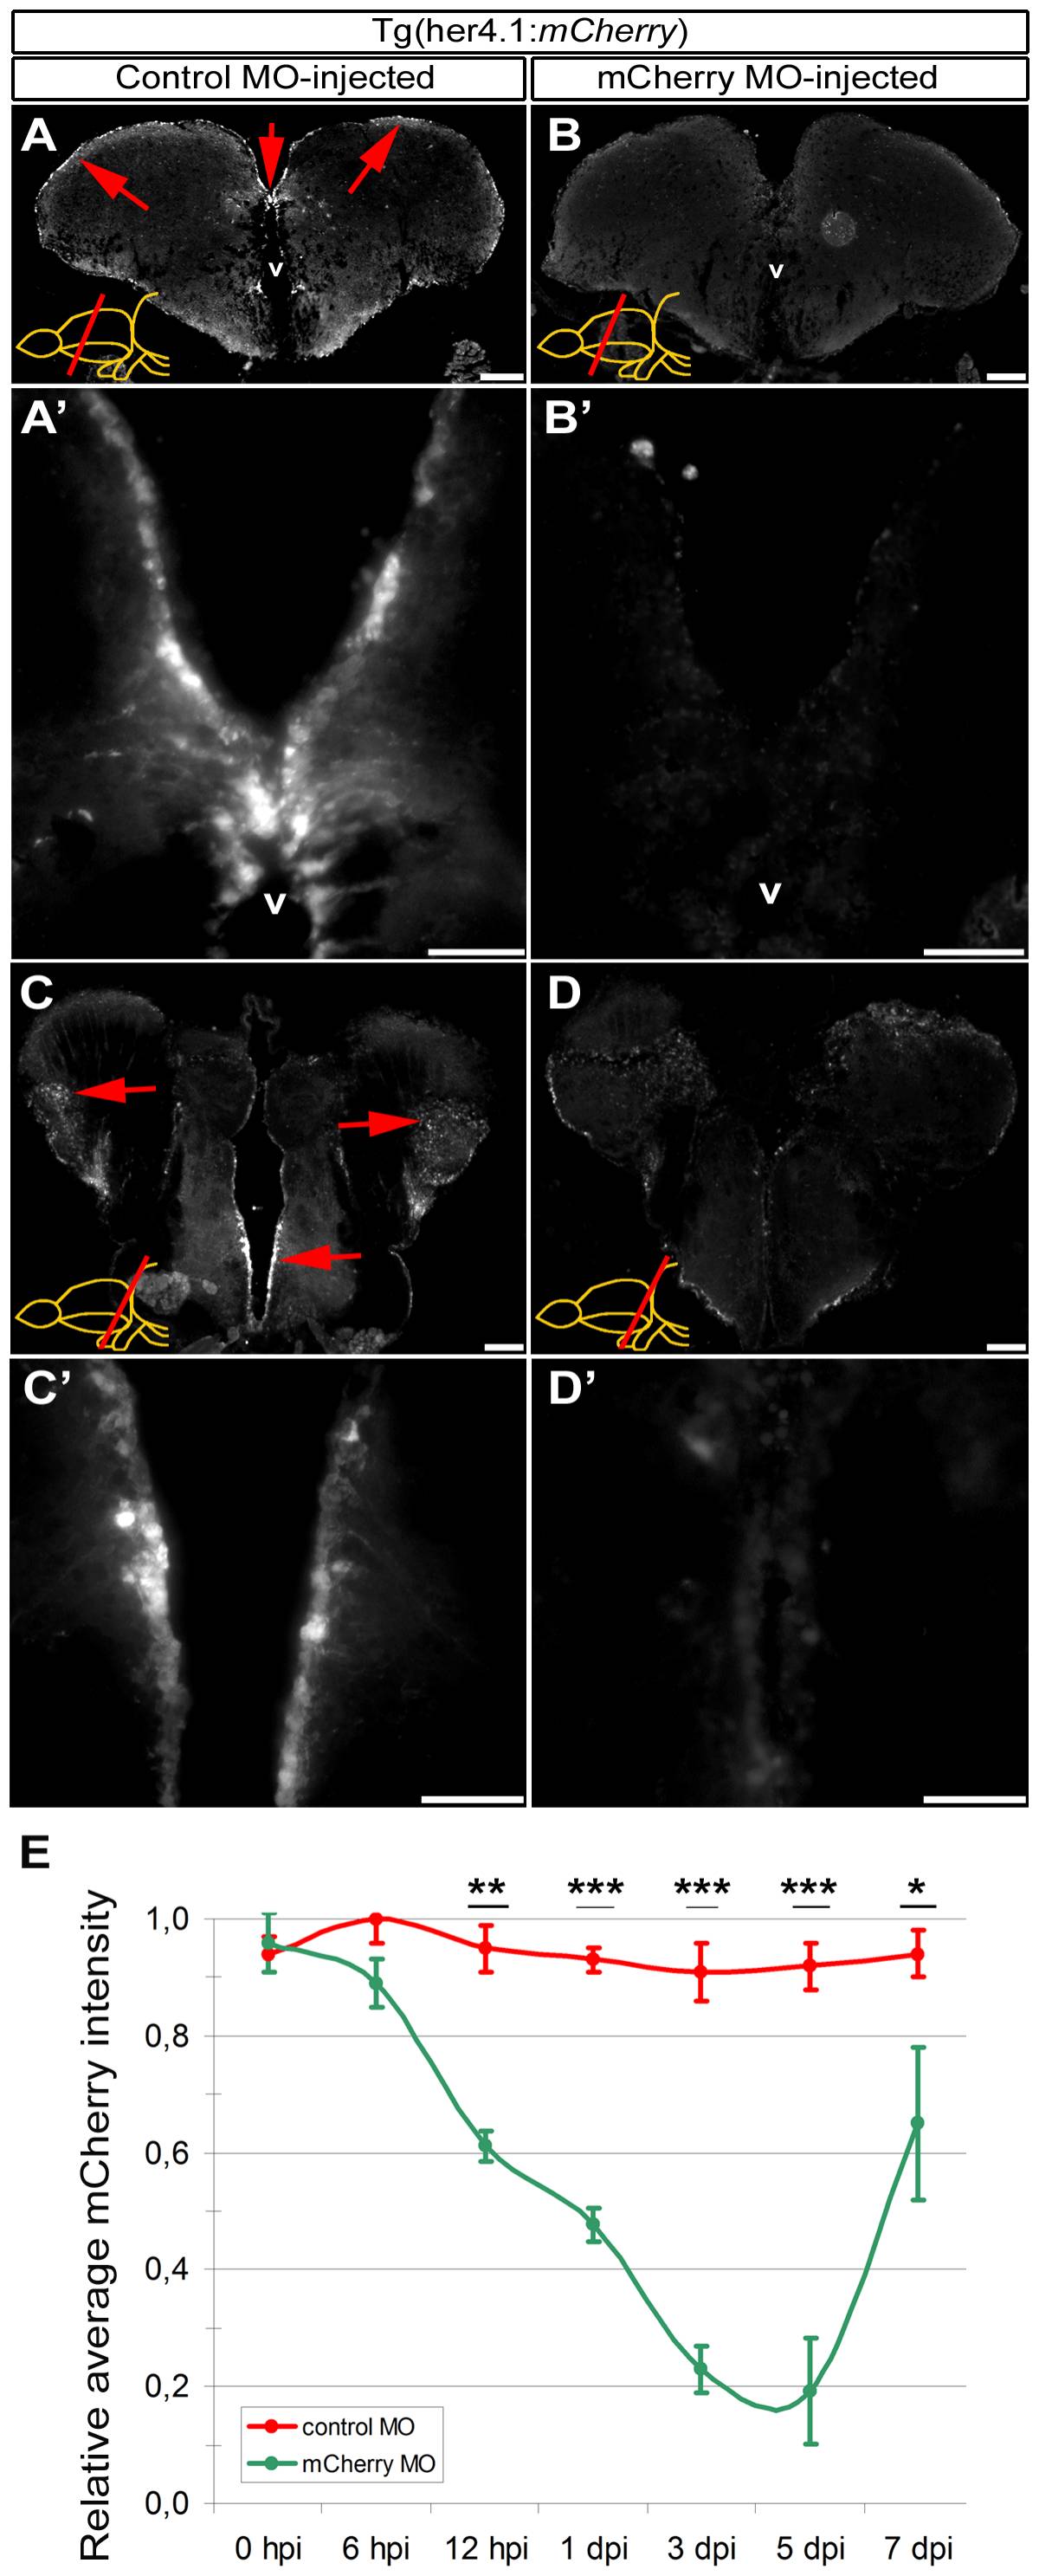
Fig. 3 Morpholino-mediated gene knockdown using CVMI in Tg(her4.1:mCherry) reporter line.
(A) Fluorescence reporter activity of Tg(her4.1:mCherry) transgenic line in the radial glial cells (red arrows along the ventricular surface) of the rostral telencephalon. (A′) Higher magnification of the dorsomedial region of A. (B) Fluorescence reporter activity in rostral telencephalon injected with translation-blocking vivo morpholinos for mCherry transgene. (B′) Higher magnification of the dorsomedial region of B, indicating the significant reduction of reporter activity. (C) Fluorescence reporter activity of Tg(her4.1:mCherry) transgenic line in the radial glial cells (red arrows along the ventricular surface) of the caudal telencephalon. (C′) Higher magnification of the medial region of C. (D) Fluorescence reporter activity in caudal telencephalon injected with translation-blocking vivo morpholinos for mCherry transgene. (D′) Higher magnification of the medial region of D, indicating the significant reduction of reporter activity. (E) Graph depicts the average mCherry fluorescence intensity in mCherry antisense morpholino-injected brains (green line) over a time course relative to control morpholino-injected brains (red line). Scale bars 50 μm. v: ventricle, tel: telencephalon, hpi: hours post injection, dpi: days post injection. N = 6 adult fish for each time point.