
|
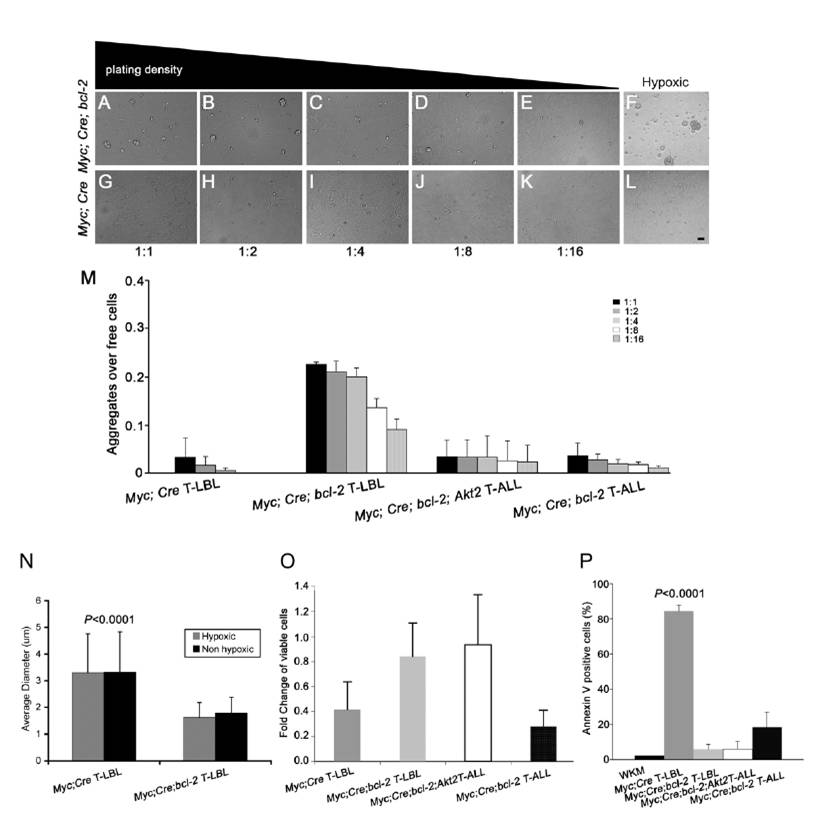
Fig. S7 T-LBL Cells Overexpressing bcl-2 and Myc are smaller, resistant to apoptosis, and from Aggregates at Low Cell Density and under Hypoxic Conditions, without active proliferation. (A-L) Brightfield images of T-LBL cells on ZKS stromal cells after 7 days of culture following serial dilution and plating (A-E and G-K), or after 8 days in hypoxic conditions (F and L). All FACS-sorted tumor cells were either from 7 Myc;Cre;bcl-2 T-LBL (top row) or Myc;Cre T-LBL (bottom row) transgenic fish. (M) Ratio of aggregates over free cells for tumor cell cultures when diluted 1:1 (black bars), 1:2 (gray bars), 1:4 (light gray bars), 1:8 (white bars), and 1:16 (black hatched bars), and grown for 7 days: Myc;Cre T-LBL (n=3; P=0.017 for 1:1 dilution; P=0.00185 for 1:2 dilution), Myc;Cre;bcl-2 T-LBL (n=4), Myc;Cre;bcl-2 T-ALL (n=4; P=0.0004 for 1:1 dilution; P=0.0021 for 1:2 dilution; P=0.017 for 1:4 dilution ), or Myc;Cre;bcl-2;Myr-Akt2 T-ALL (n=5; P=0.0018 for 1:1 dilution; P=0.0137 for 1:2 dilution; P=0.028 for 1:4 dilution ) transgenic fish. (N) Average diameters of cells under hypoxic (gray) and normal (black) culture conditions for Myc;Cre;bcl-2 vs. Myc;Cre tumor cells (mean ± SD μm diameter of cell under normal conditions: 1.79 ± 0.59 vs. 3.33 ± 1.50; n=110 for each group, P<0.0001; mean ± SD μm diameter of cell under hypoxic conditions: 1.62 ± 0.55 vs. 3.30 ± 1.46; n=110 for each group, P<0.0001;). (O) Fold change in viable lymphoma or leukemic cells between 1 and 7 days postculture on ZKS stroma cells from Myc;Cre T-LBL (dark gray bar, n=3), Myc;Cre;bcl-2 T-LBL (light gray bar, n=4), Myc;Cre;bcl-2;Akt2 (white bar, n=5), and Myc;Cre;bcl-2 T-ALL (black bar, n=4) transgenic fish. (P) Percentage of Annexin V-positive cells from whole kidney marrow (WKM; black bar), Myc;Cre T-LBL (dark gray bar, n=3), Myc;Cre;bcl-2 T-LBL (light gray, n=4), Myc;Cre;bcl-2;Akt2 (white bar, n=5), and Myc;Cre;bcl-2 T-ALL (black bar, n=4) cells after 7 days in culture. Data are reported as means ± SD. Scale bar for panels A-L = 40 μm.
Reprinted from Cancer Cell, 18(4), Feng, H., Stachura, D.L., White, R.M., Gutierrez, A., Zhang, L., Sanda, T., Jette, C.A., Testa, J.R., Neuberg, D.S., Langenau, D.M., Kutok, J.L., Zon, L.I., Traver, D., Fleming, M.D., Kanki, J.P., and Look, A.T., T-lymphoblastic lymphoma cells express high levels of BCL2, S1P1, and ICAM1, leading to a blockade of tumor cell intravasation, 353-366, Copyright (2010) with permission from Elsevier. Full text @ Cancer Cell