
|
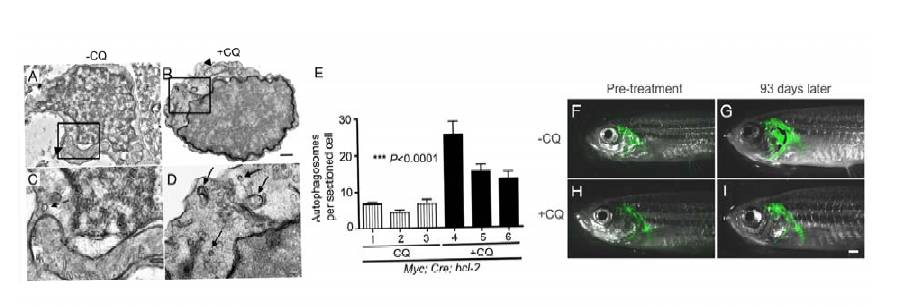
Fig. S3 Autophagy Inhibition of Myc;Cre;bcl-2 T-LBL Cells Fails to Promote Dissemination of the Disease. (A-D) Electron microscopy demonstrate increased autophagosome formation in tumor cells from chloroquine (CQ)-treated Myc;Cre;bcl-2 transgenic fish (B,D), compared to tumor cells from control-treated animals (A,C). Mitochondria are indicated by arrowheads and double-membrane autophagosomes containing cytoplasm and cytoplasmic organelles by arrows. Panels C and D are an expanded view of the boxes in A and B. (E) Quantification of autophagosomes and autolysophagosomes in control-treated (hatched bars) and chloroquine-treated Myc;Cre;bcl-2 (solid bars) tumor cells harvested from three individual fish. Between 15-20 individual cells from each fish were sectioned and analyzed; the data are reported as means ± SD. Combined results for control-treated fish differ significantly from CQ-treated Myc;Cre;bcl-2 fish (P<0.0001). (F-I) Despite CQ treatment over 93 days, significant differences in the progression or regression of T-LBL in Myc;Cre;bcl-2 fish were not detected relative to control-treated fish. Scale bars for panels A-B = 500 nm; for panels C-D = 100nm; and for panels F-I = 1mm.
Reprinted from Cancer Cell, 18(4), Feng, H., Stachura, D.L., White, R.M., Gutierrez, A., Zhang, L., Sanda, T., Jette, C.A., Testa, J.R., Neuberg, D.S., Langenau, D.M., Kutok, J.L., Zon, L.I., Traver, D., Fleming, M.D., Kanki, J.P., and Look, A.T., T-lymphoblastic lymphoma cells express high levels of BCL2, S1P1, and ICAM1, leading to a blockade of tumor cell intravasation, 353-366, Copyright (2010) with permission from Elsevier. Full text @ Cancer Cell