
|
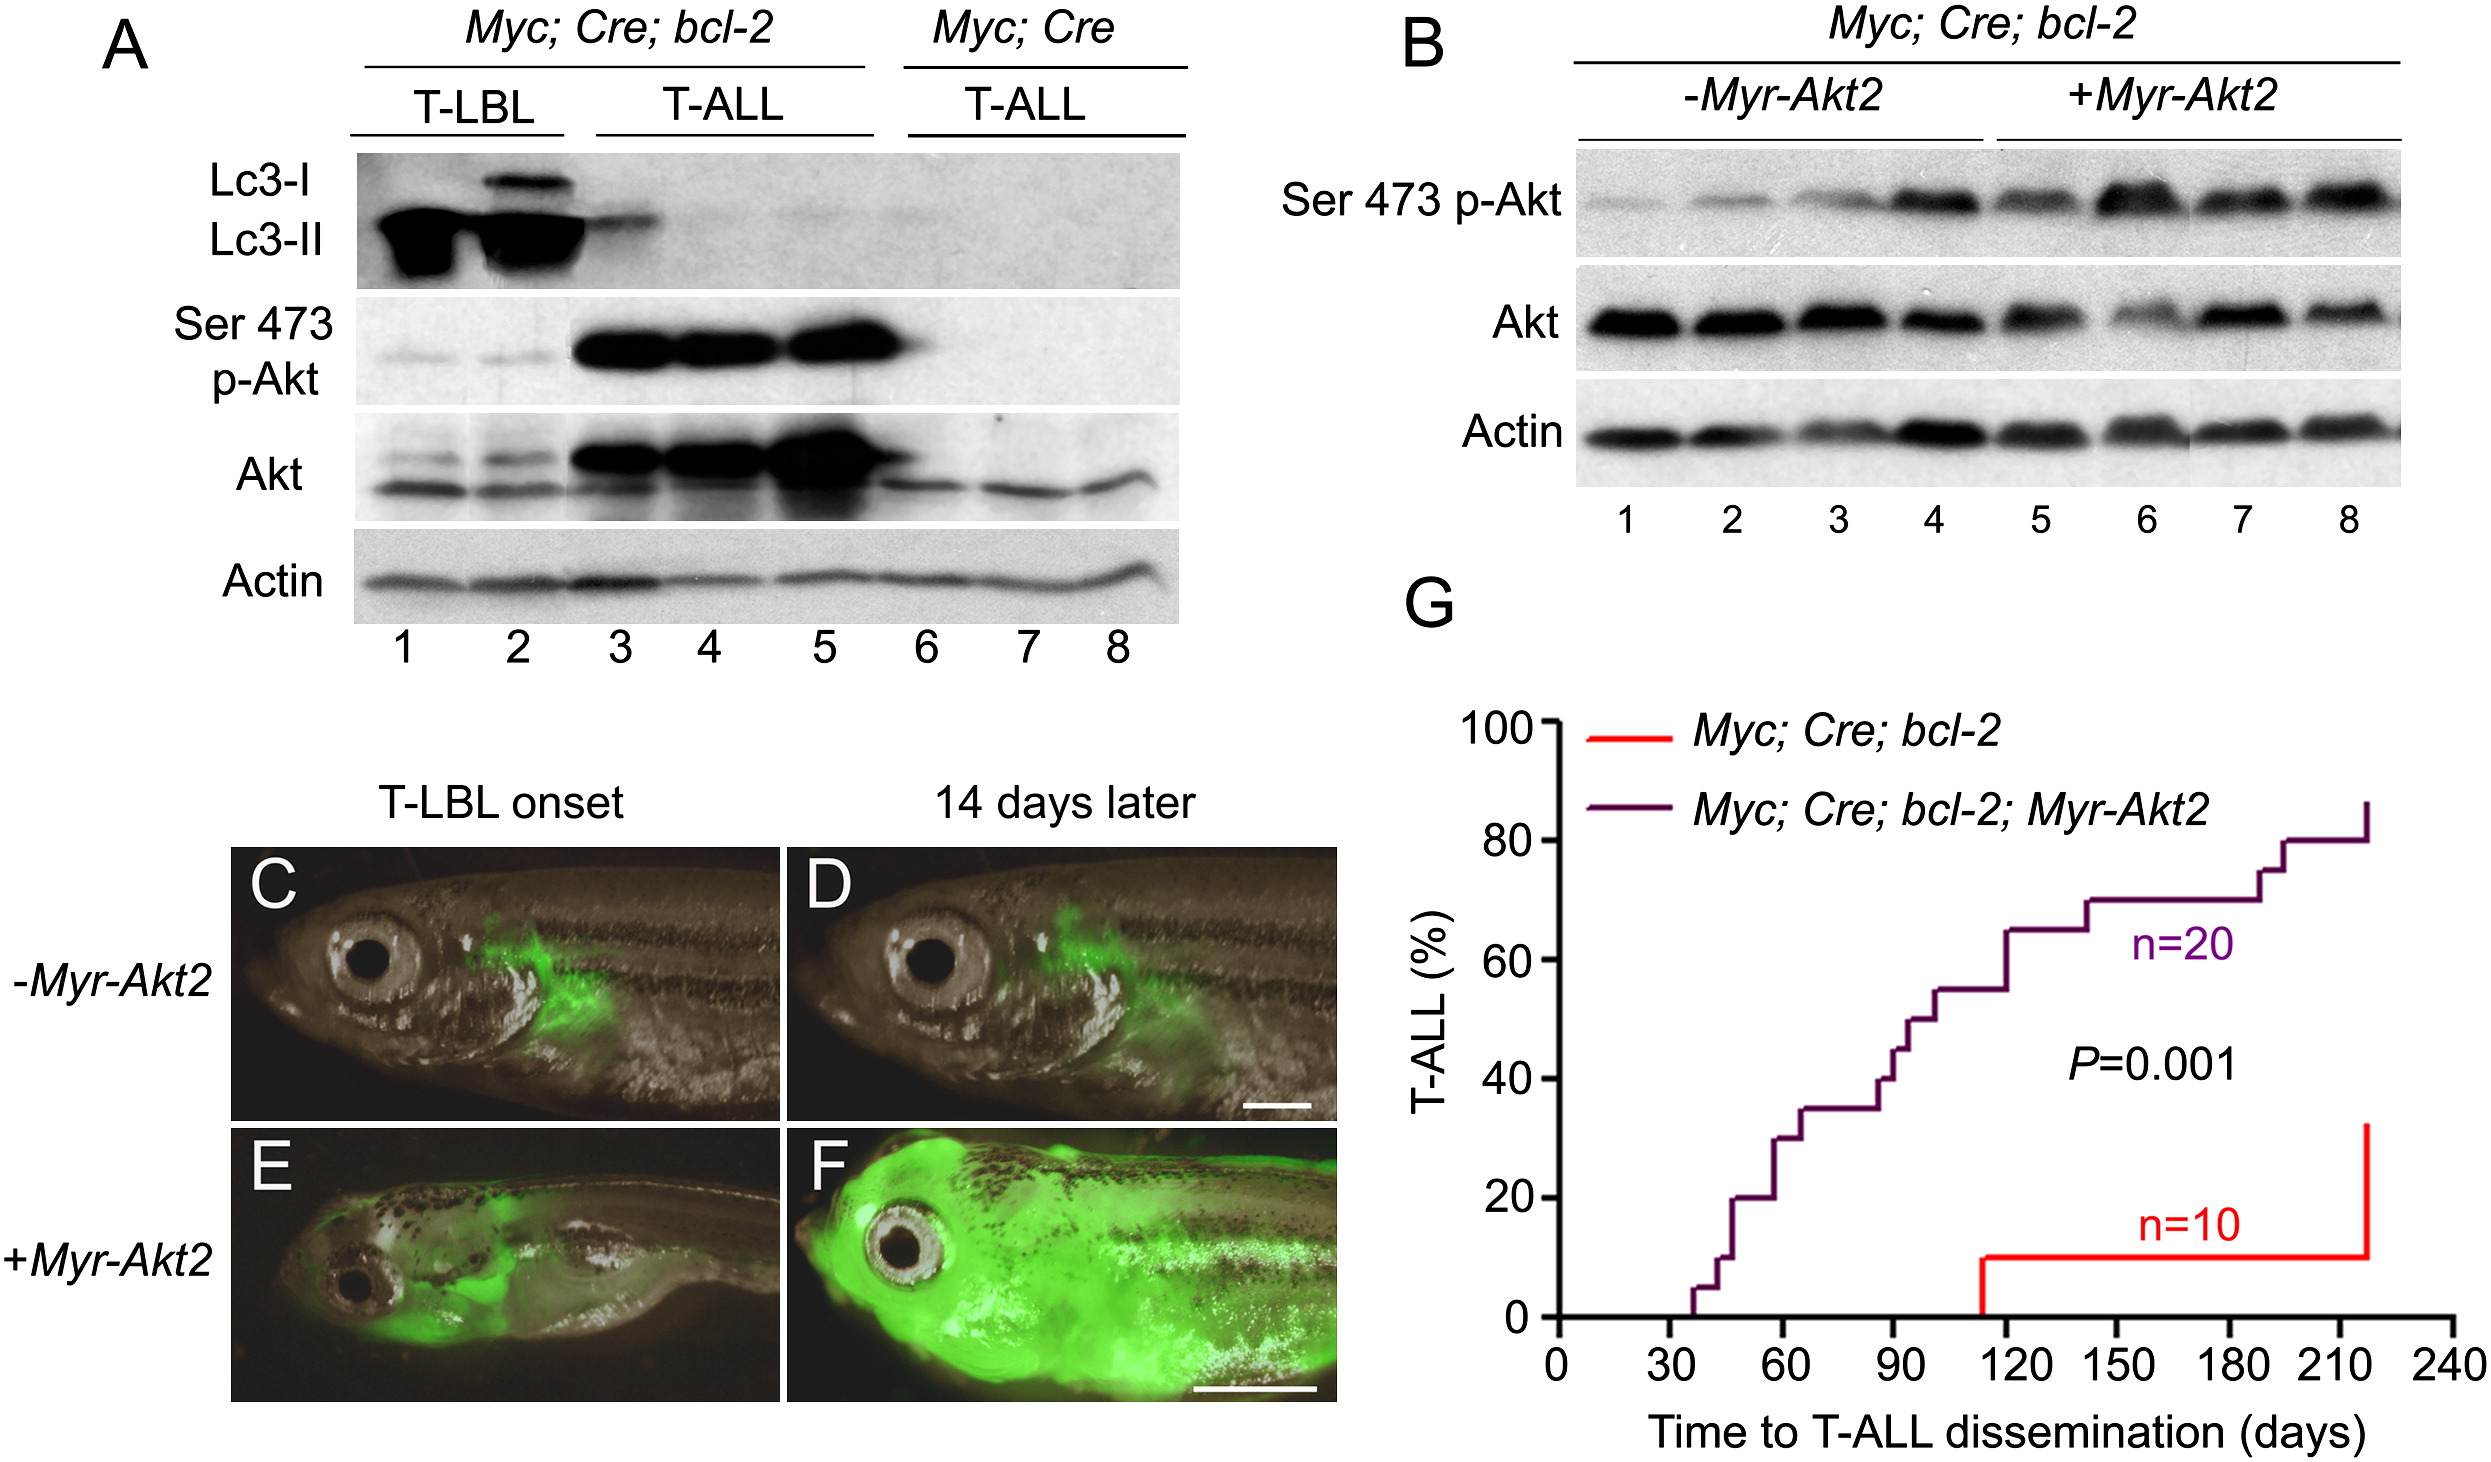
Fig. 4 Akt Activation Promotes the Progression of T-LBL to T-ALL in Myc;Cre;bcl-2 Transgenic Fish
(A) Western blot analysis of Lc3-I, Lc3-II, Ser473p-Akt, and Akt protein expression in zebrafish Myc;Cre;bcl-2 lymphoma (two tumor samples) and leukemia (three tumor samples) cells and in zebrafish Myc;Cre leukemia cells (three tumor samples).
(B) Western blot analysis of Ser473p-Akt and Akt expression in Myc;Cre;bcl-2 (n = 4) and Myc;Cre;bcl-2;Myr-Akt2 (n = 4) zebrafish lymphomas.
(C–F) Upon constitutive activation of Myr-Akt2, Myc;Cre;bcl-2 transgenic fish rapidly progress from T-LBL (E; T-LBL onset at 20 days) to T-ALL (F; at 34 days), compared with the Myc;Cre;bcl-2 transgenic fish lacking Myr-Akt2 expression (C and D).
(G) Rate of T-LBL progression to T-ALL in Myc;Cre;bcl-2 transgenic fish (n = 10; red) and Myc;Cre;bcl-2;Akt2 transgenic fish (n = 20; purple). Actin protein levels in (A) and (B) served as loading controls. Scale bars for (C)–(F), 1 mm.
See also Figure S4.
Reprinted from Cancer Cell, 18(4), Feng, H., Stachura, D.L., White, R.M., Gutierrez, A., Zhang, L., Sanda, T., Jette, C.A., Testa, J.R., Neuberg, D.S., Langenau, D.M., Kutok, J.L., Zon, L.I., Traver, D., Fleming, M.D., Kanki, J.P., and Look, A.T., T-lymphoblastic lymphoma cells express high levels of BCL2, S1P1, and ICAM1, leading to a blockade of tumor cell intravasation, 353-366, Copyright (2010) with permission from Elsevier. Full text @ Cancer Cell