
Image
|
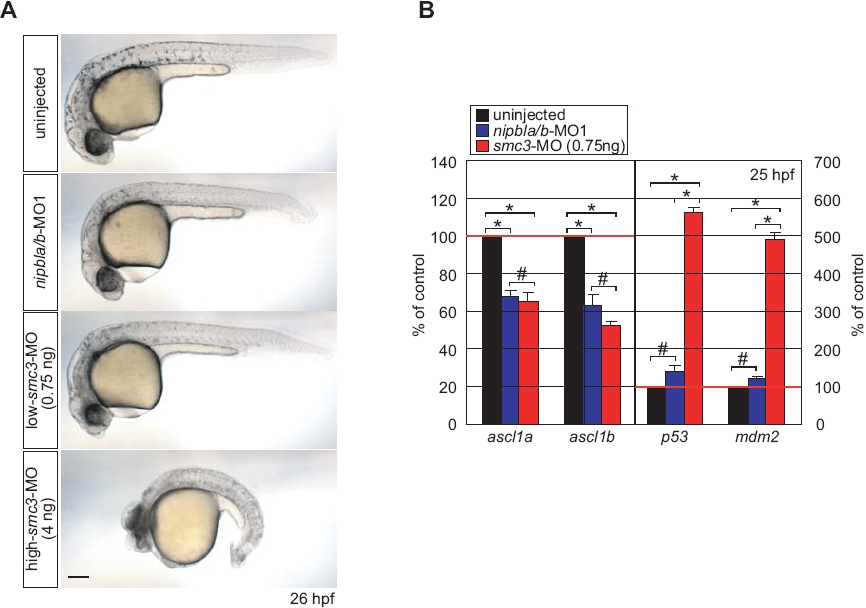
Figure Caption
Fig. S11
Effects of low amounts of smc3-MO on gene expression. (A) Morphology of living embryos at 26 hpf. Lateral views with anterior to the left. (B) Q-PCR analyses of gene expression in uninjected control (black), nipbla/b-morphants (blue), and low-smc3 (0.75 ng)-morphants (red) at 25 hpf by Q-PCR (n = 3, mean ± S.E.M.; * p<0.05 and # p>0.1 by paired t test). Scale bar: 100 μm.
Acknowledgments
This image is the copyrighted work of the attributed author or publisher, and
ZFIN has permission only to display this image to its users.
Additional permissions should be obtained from the applicable author or publisher of the image.
Full text @ PLoS Biol.