
Image
|
Figure Caption
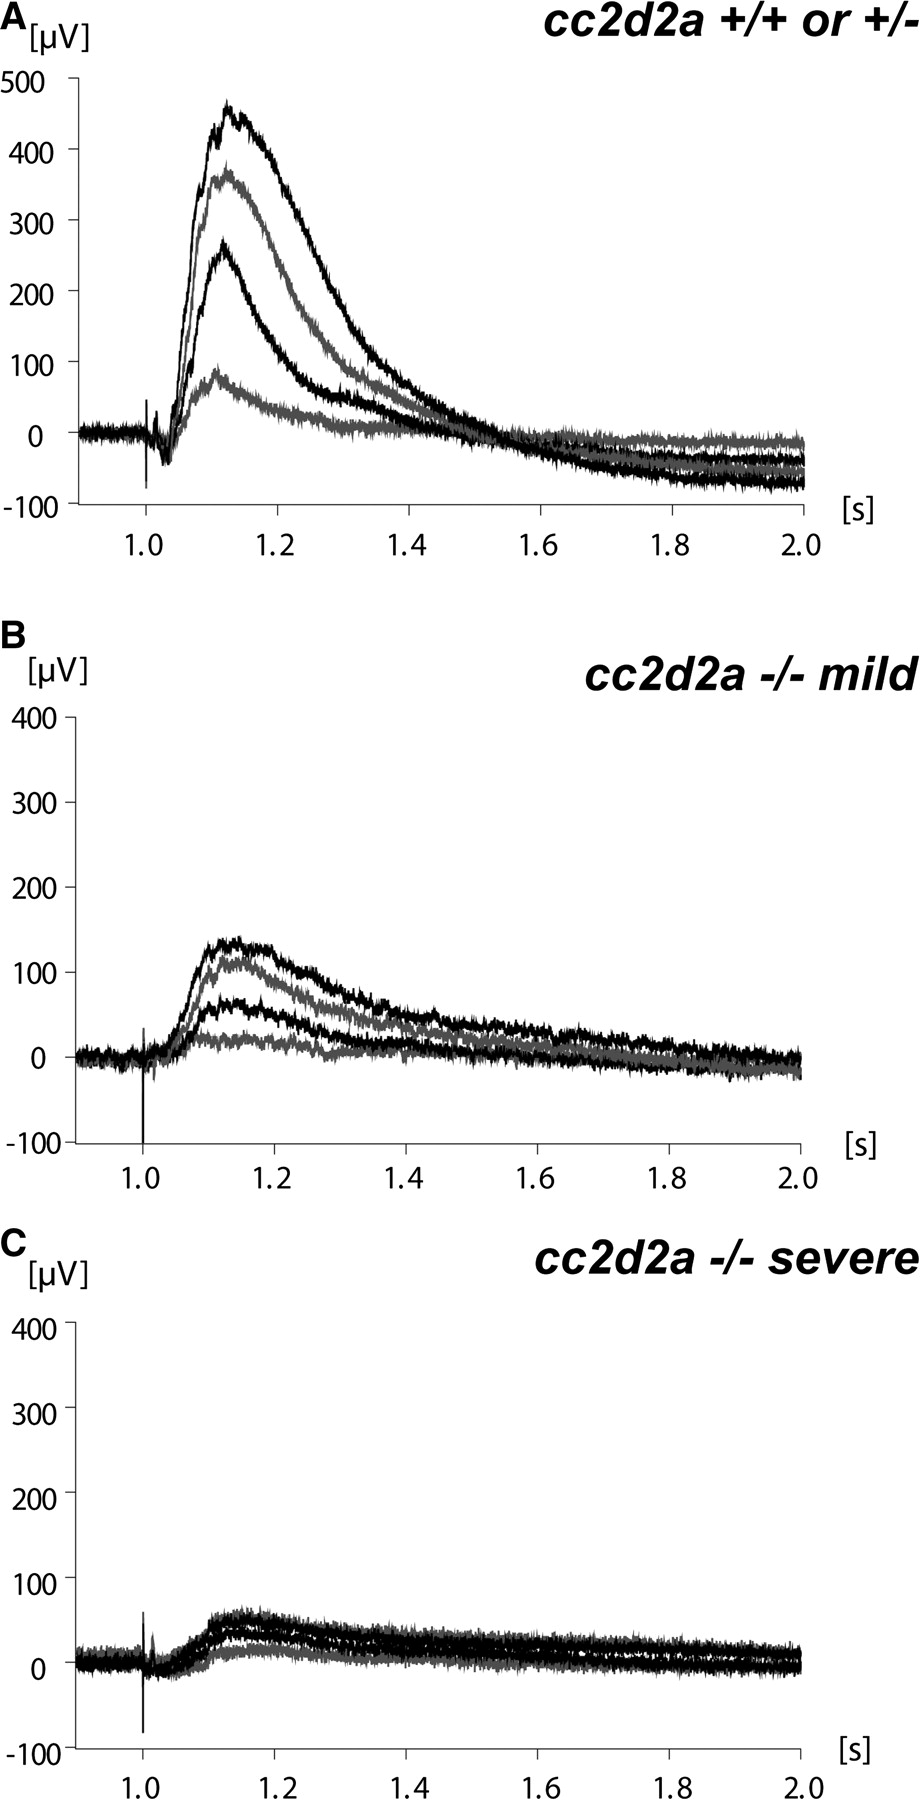
Fig. 2 Visual function is abnormal in cc2d2a-/- zebrafish. (A) Representative ERG from cc2d2a+/+ or +/- 6 d.p.f. fish (n = 6). (B and C) ERGs from mildly (B) and severely (C) affected cc2d2a-/- 6 d.p.f. fish (n = 6). Different tracings in each graph represent different light intensities.
Figure Data
Acknowledgments
This image is the copyrighted work of the attributed author or publisher, and
ZFIN has permission only to display this image to its users.
Additional permissions should be obtained from the applicable author or publisher of the image.
Full text @ Hum. Mol. Genet.