
|
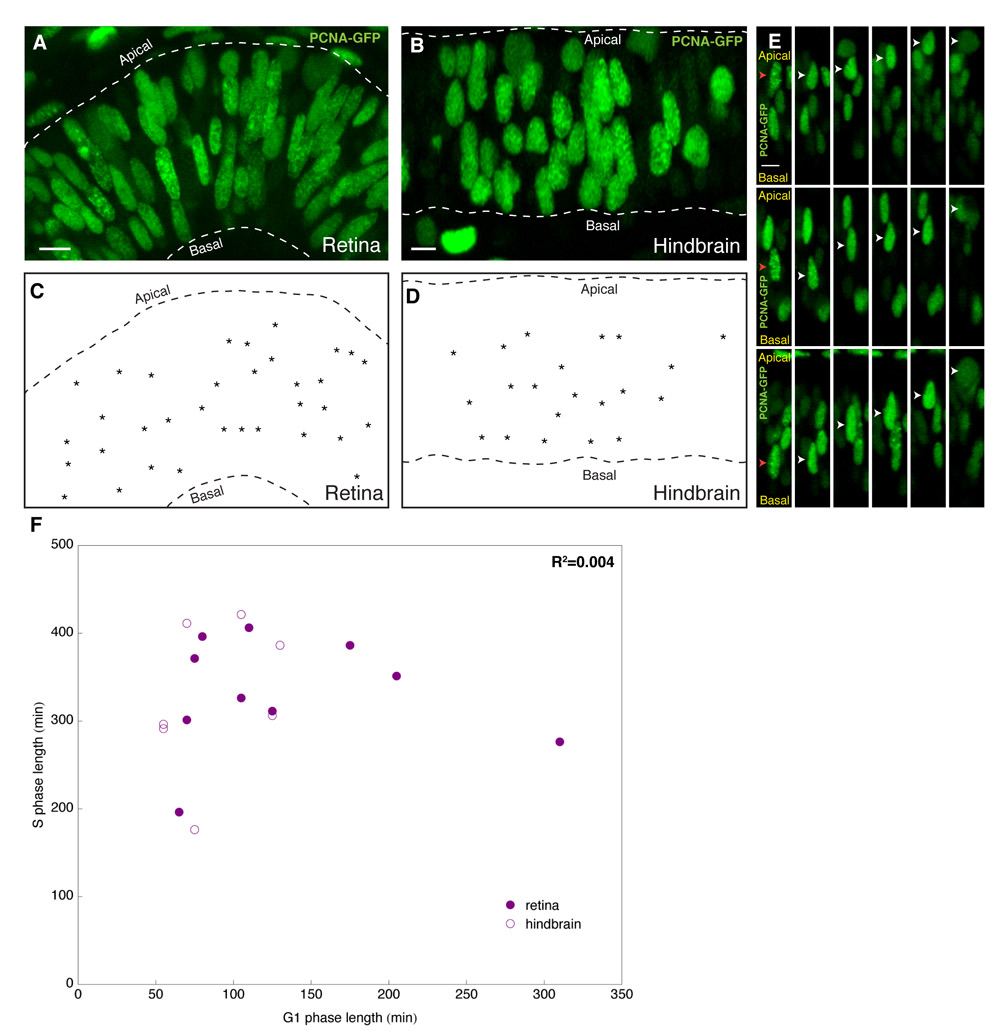
Fig. S3 S phase is distributed throughout the apicobasal extent of retinal and hindbrain epithelia. (A-D) Typical optical slice through retina (A) or hindbrain (B) neuroepithelia at 24 hpf expressing PCNA-GFP through RNA injection. S-phase nuclei dominate in proportion in these tissues and can be seen throughout the apicobasal extent of these epithelia, as further depicted in schematics (C,D), in which S-phase nuclei of the corresponding image are marked (asterisks). (E) Kymographs showing directed apical motion of nuclei (white arrowhead) from S phase to M phase occurring irrespective of their apicobasal start position (red arrow). (F) S- and G-phase length comparison. Each circle represents the G1 (x-axis) and S (y-axis) phase length of a nucleus imaged in time-lapse. There was variability in the duration of both S and G1 between cells, but no correlation between the lengths of G1 and S. Scale bars: 10 μm.