
Image
|
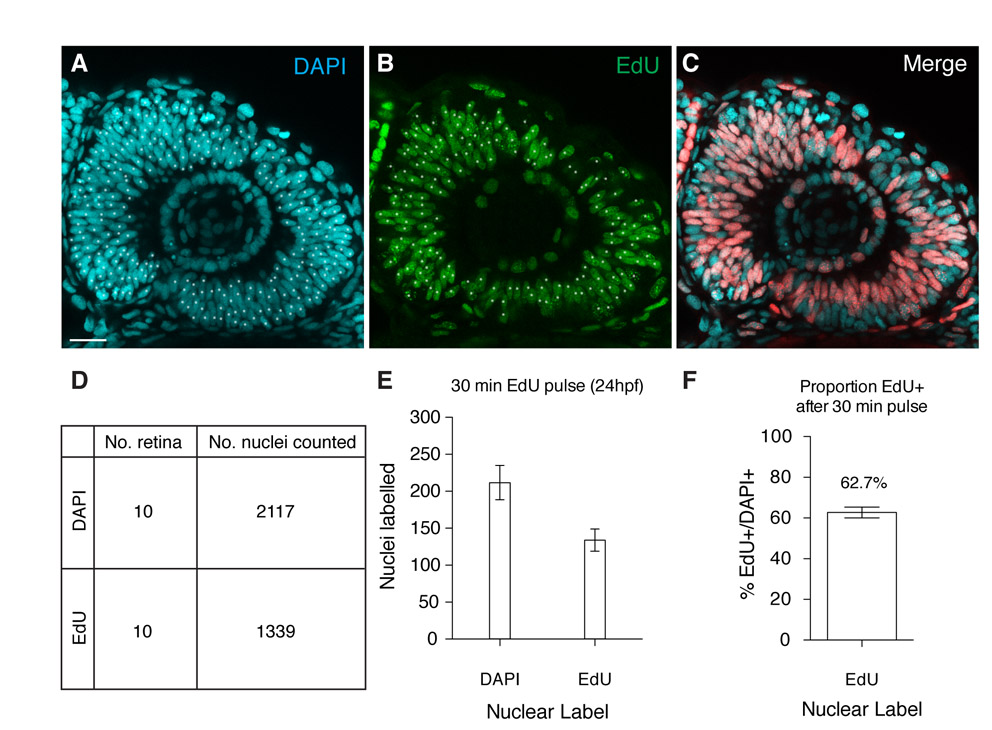
Figure Caption
Fig. S1 Short EdU labeling corroborates PCNA-GFP S-phase estimates. (A-C) Typical retina labeled with short pulse EdU (B) counterstained with DAPI (A). (D) The number of retina and nuclei counted. (E,F) The mean number of nuclei counted and the proportion of EdU-positive nuclei to total number. Error bars indicate s.e.m. Scale bar: 50 μm.
Acknowledgments
This image is the copyrighted work of the attributed author or publisher, and
ZFIN has permission only to display this image to its users.
Additional permissions should be obtained from the applicable author or publisher of the image.
Full text @ Development