
|
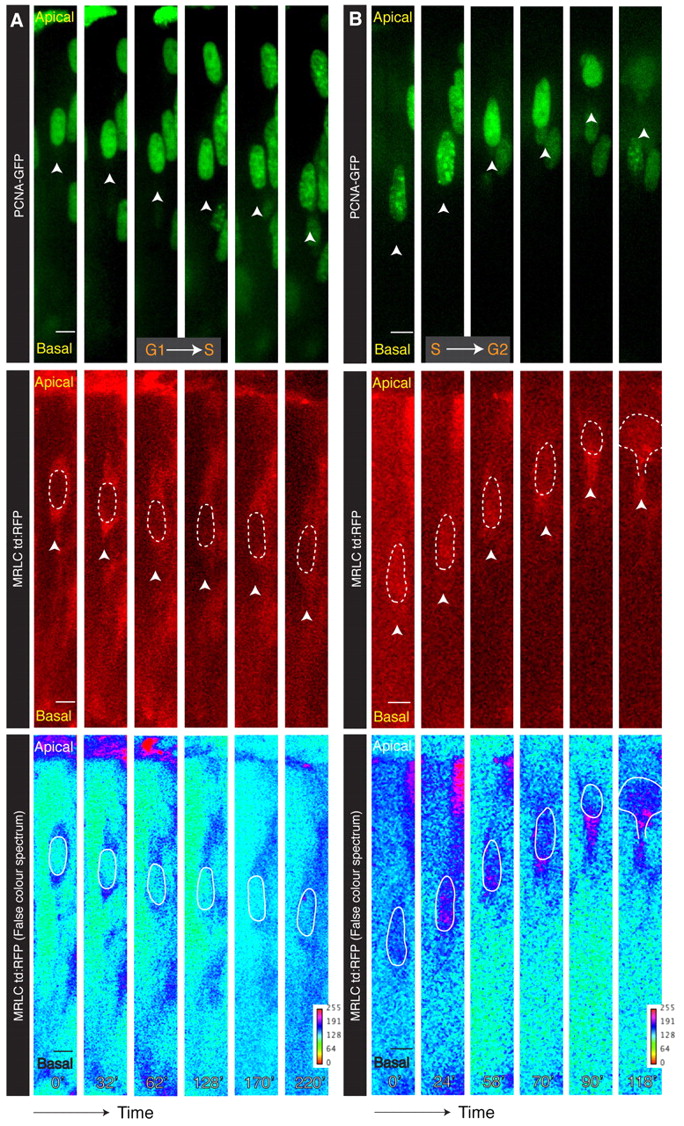
Fig. 4 Temporal relationship of myosin localization with specific cell cycle phases. (A) Kymograph from supplementary material Movie 5 showing that Myosin regulatory light chain (MRLC) surrounds nuclei symmetrically in G1 and S phases. (B) Kymograph from supplementary material Movie 6 showing that MRLC accumulates basally after nuclei have entered G2 and separately for the cytokinetic furrow. The nucleus traced using the PCNA-GFP channel is outlined with broken line. Arrowheads in PCNA-GFP and MRLC:td:RFP channels are in equivalent positions, indicating the basal side of the nucleus over time. Scale bars: 5 μm.