
|
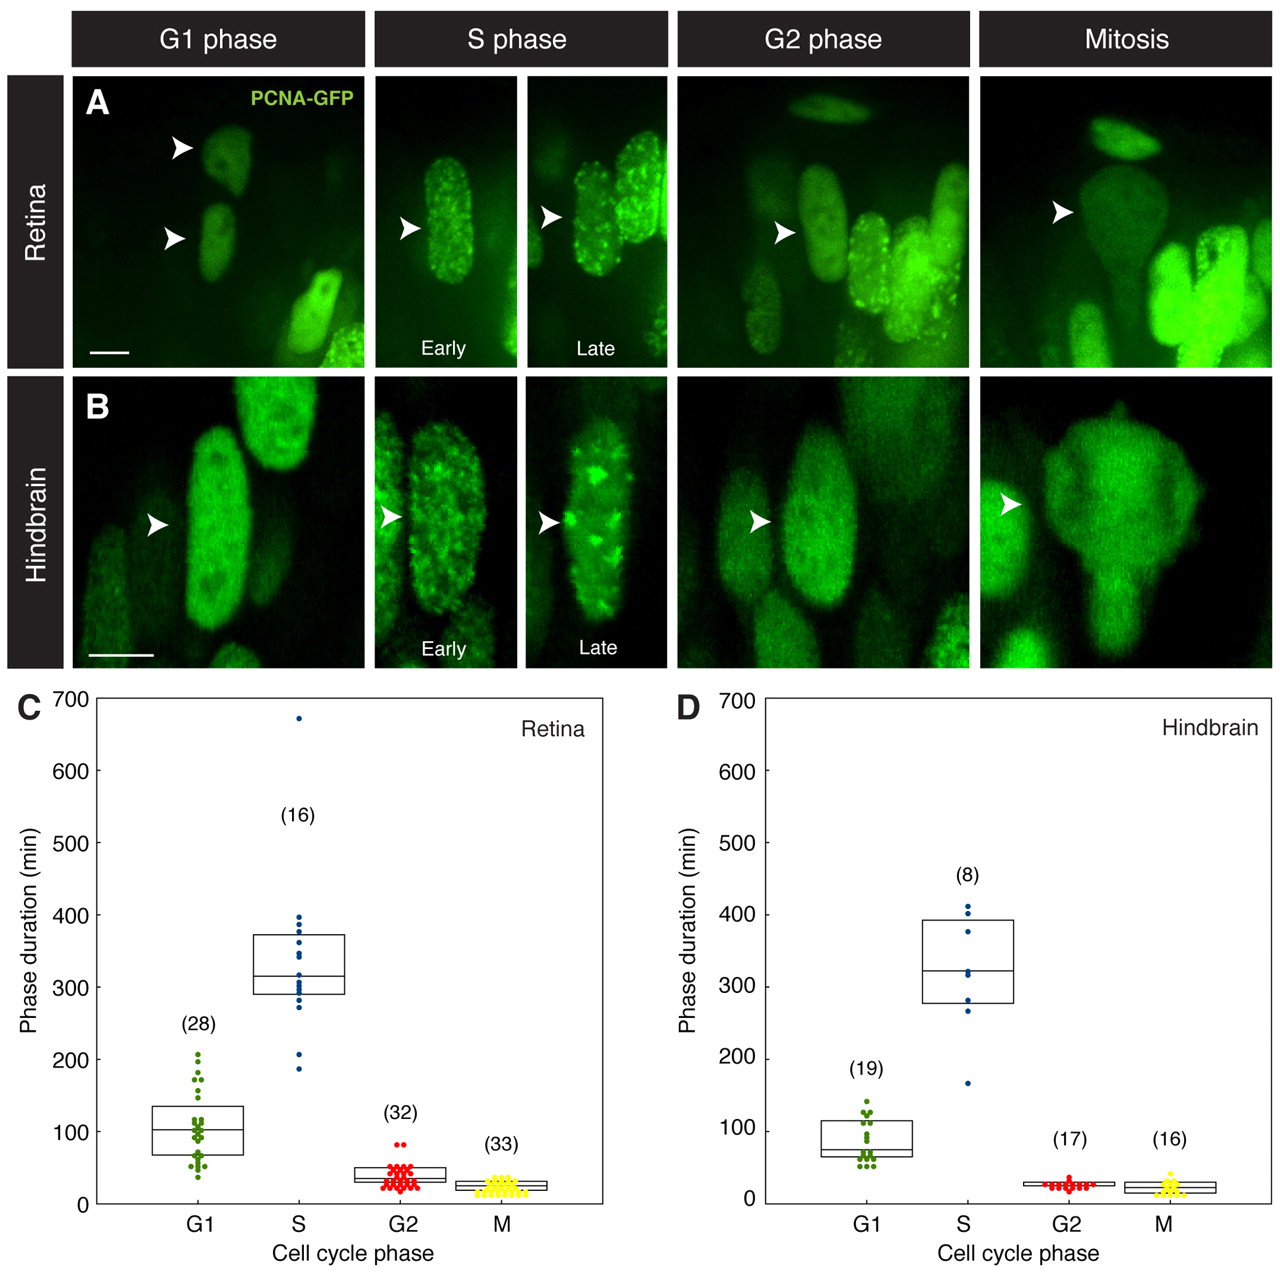
Fig. 1 PCNA-GFP marks cell cycle phases. (A) Still images of zebrafish retinal nuclei followed through the cell cycle. Phases can be identified by the differential distribution of PCNA-GFP (arrowheads). (B) Similar cell cycle phase identification is possible for nuclei in hindbrain neuroepithelia (arrowheads). (C,D) Box plots illustrating distributed lengths of cell cycle phases for retinal (C) and hindbrain (D) nuclei. The top and bottom of each box indicate upper and lower quartiles, respectively; the horizontal line represents the median. The number of nuclei followed for each cell cycle phase is indicated in parentheses. Scale bars: 10 μm.