
Fig. 3
|
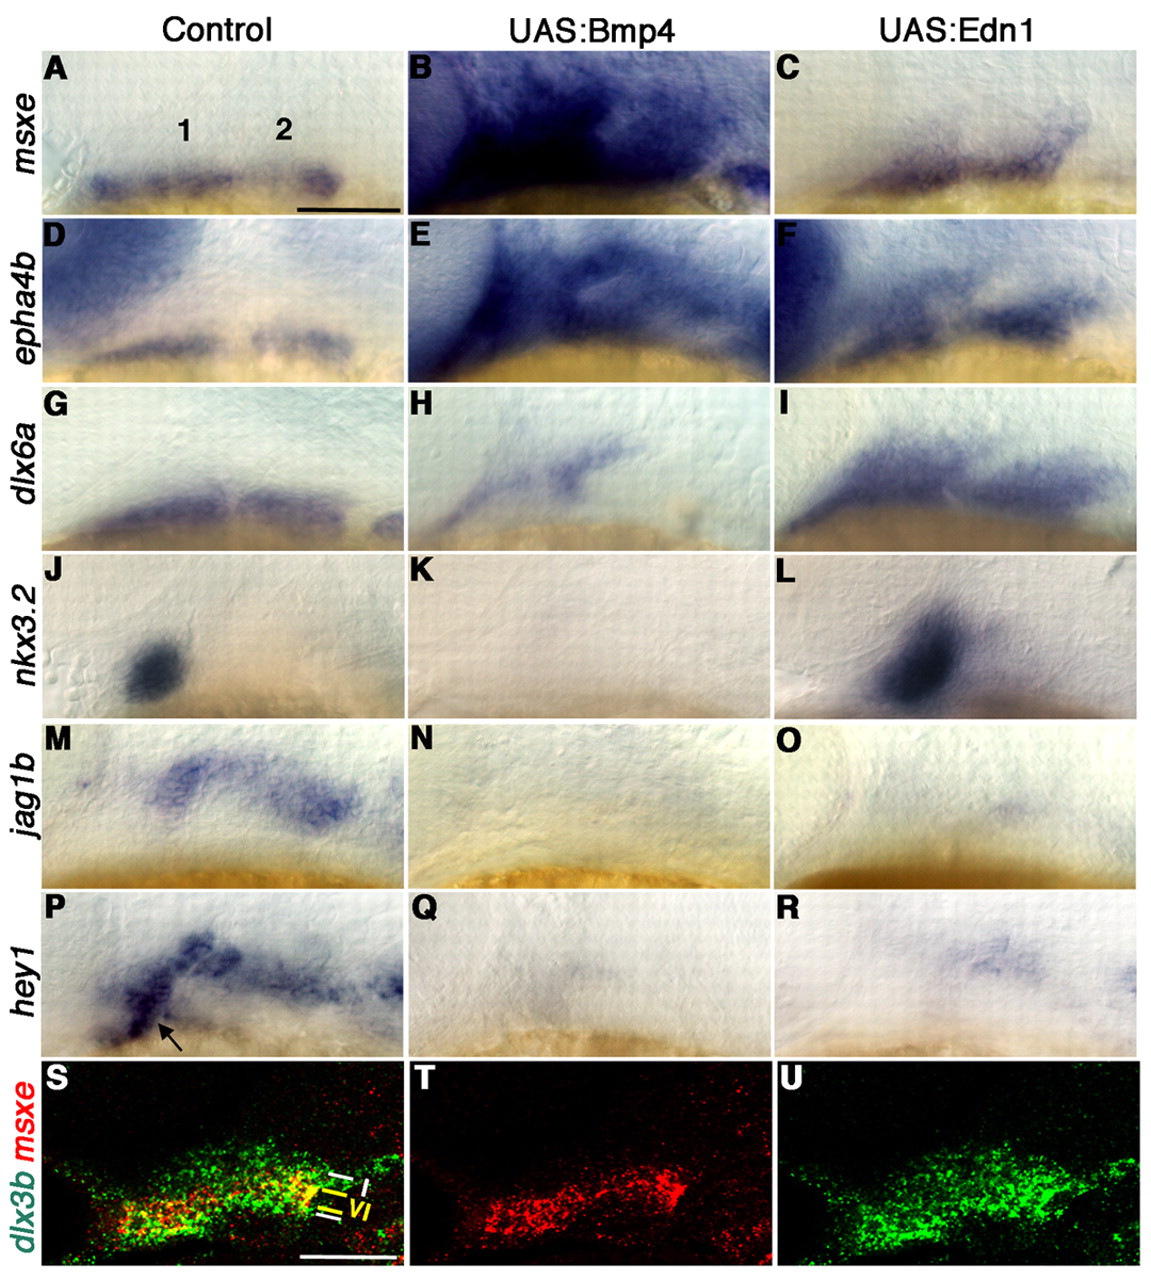
Fig. 3 DV gene expression in Bmp4 and Edn1 misexpression embryos. (A-R) In situ hybridization shows gene expression in the mandibular (1) and hyoid (2) arches of control hsp70I:Gal4 and hsp70I:Gal4; UAS:Bmp4 embryos subjected to a 20-24 hpf heat-shock and hsp70I:Gal4; UAS:Edn1 embryos subjected to a 20-28 hpf heat-shock. (A-C) msxe (36 hpf): compared with controls (A, n=22), expression was markedly expanded in UAS:Bmp4 (B, n=17/18) and slightly expanded in UAS:Edn1 (C, n=10/12) embryos. (D-F) epha4b (36 hpf): compared with controls (D, n=11), expression was markedly expanded in UAS:Bmp4 (E, n=12/12) and moderately expanded in UAS:Edn1 (F, n=20/20) embryos. (G-I) dlx6a (36 hpf): compared with controls (G, n=8), expression was variably expanded (n=4/7) or reduced (n=3/7) in UAS:Bmp4 (H), and markedly expanded in UAS:Edn1 (I, n=28/28) embryos. (J-L) nkx3.2 (44 hpf): compared with controls (J, n=13), expression was lost in UAS:Bmp4 (K, n=9/9) and expanded in UAS:Edn1 (L, n=21/25) embryos. (M-O) jag1b (36 hpf): compared with controls (M, n=14), expression was reduced in UAS:Bmp4 (N, n=14/20) and UAS:Edn1 (O, n=21/25) embryos. (P-R) hey1 (36 hpf): compared with controls (P, n=36), expression was reduced in UAS:Bmp4 (Q, n=26/27) and UAS:Edn1 (R, n=19/26) embryos. Arrow indicates hey1 staining in ventral mesoderm. (S-U) Confocal sections of in situ hybridizations for dlx3b (green) and msxe (red) in a 36 hpf wild-type embryo. Merged (S) and single (T,U) panels are shown. Intermediate (I) and ventral-intermediate (VI) domains are depicted. Scale bars: 50 μm.