
|
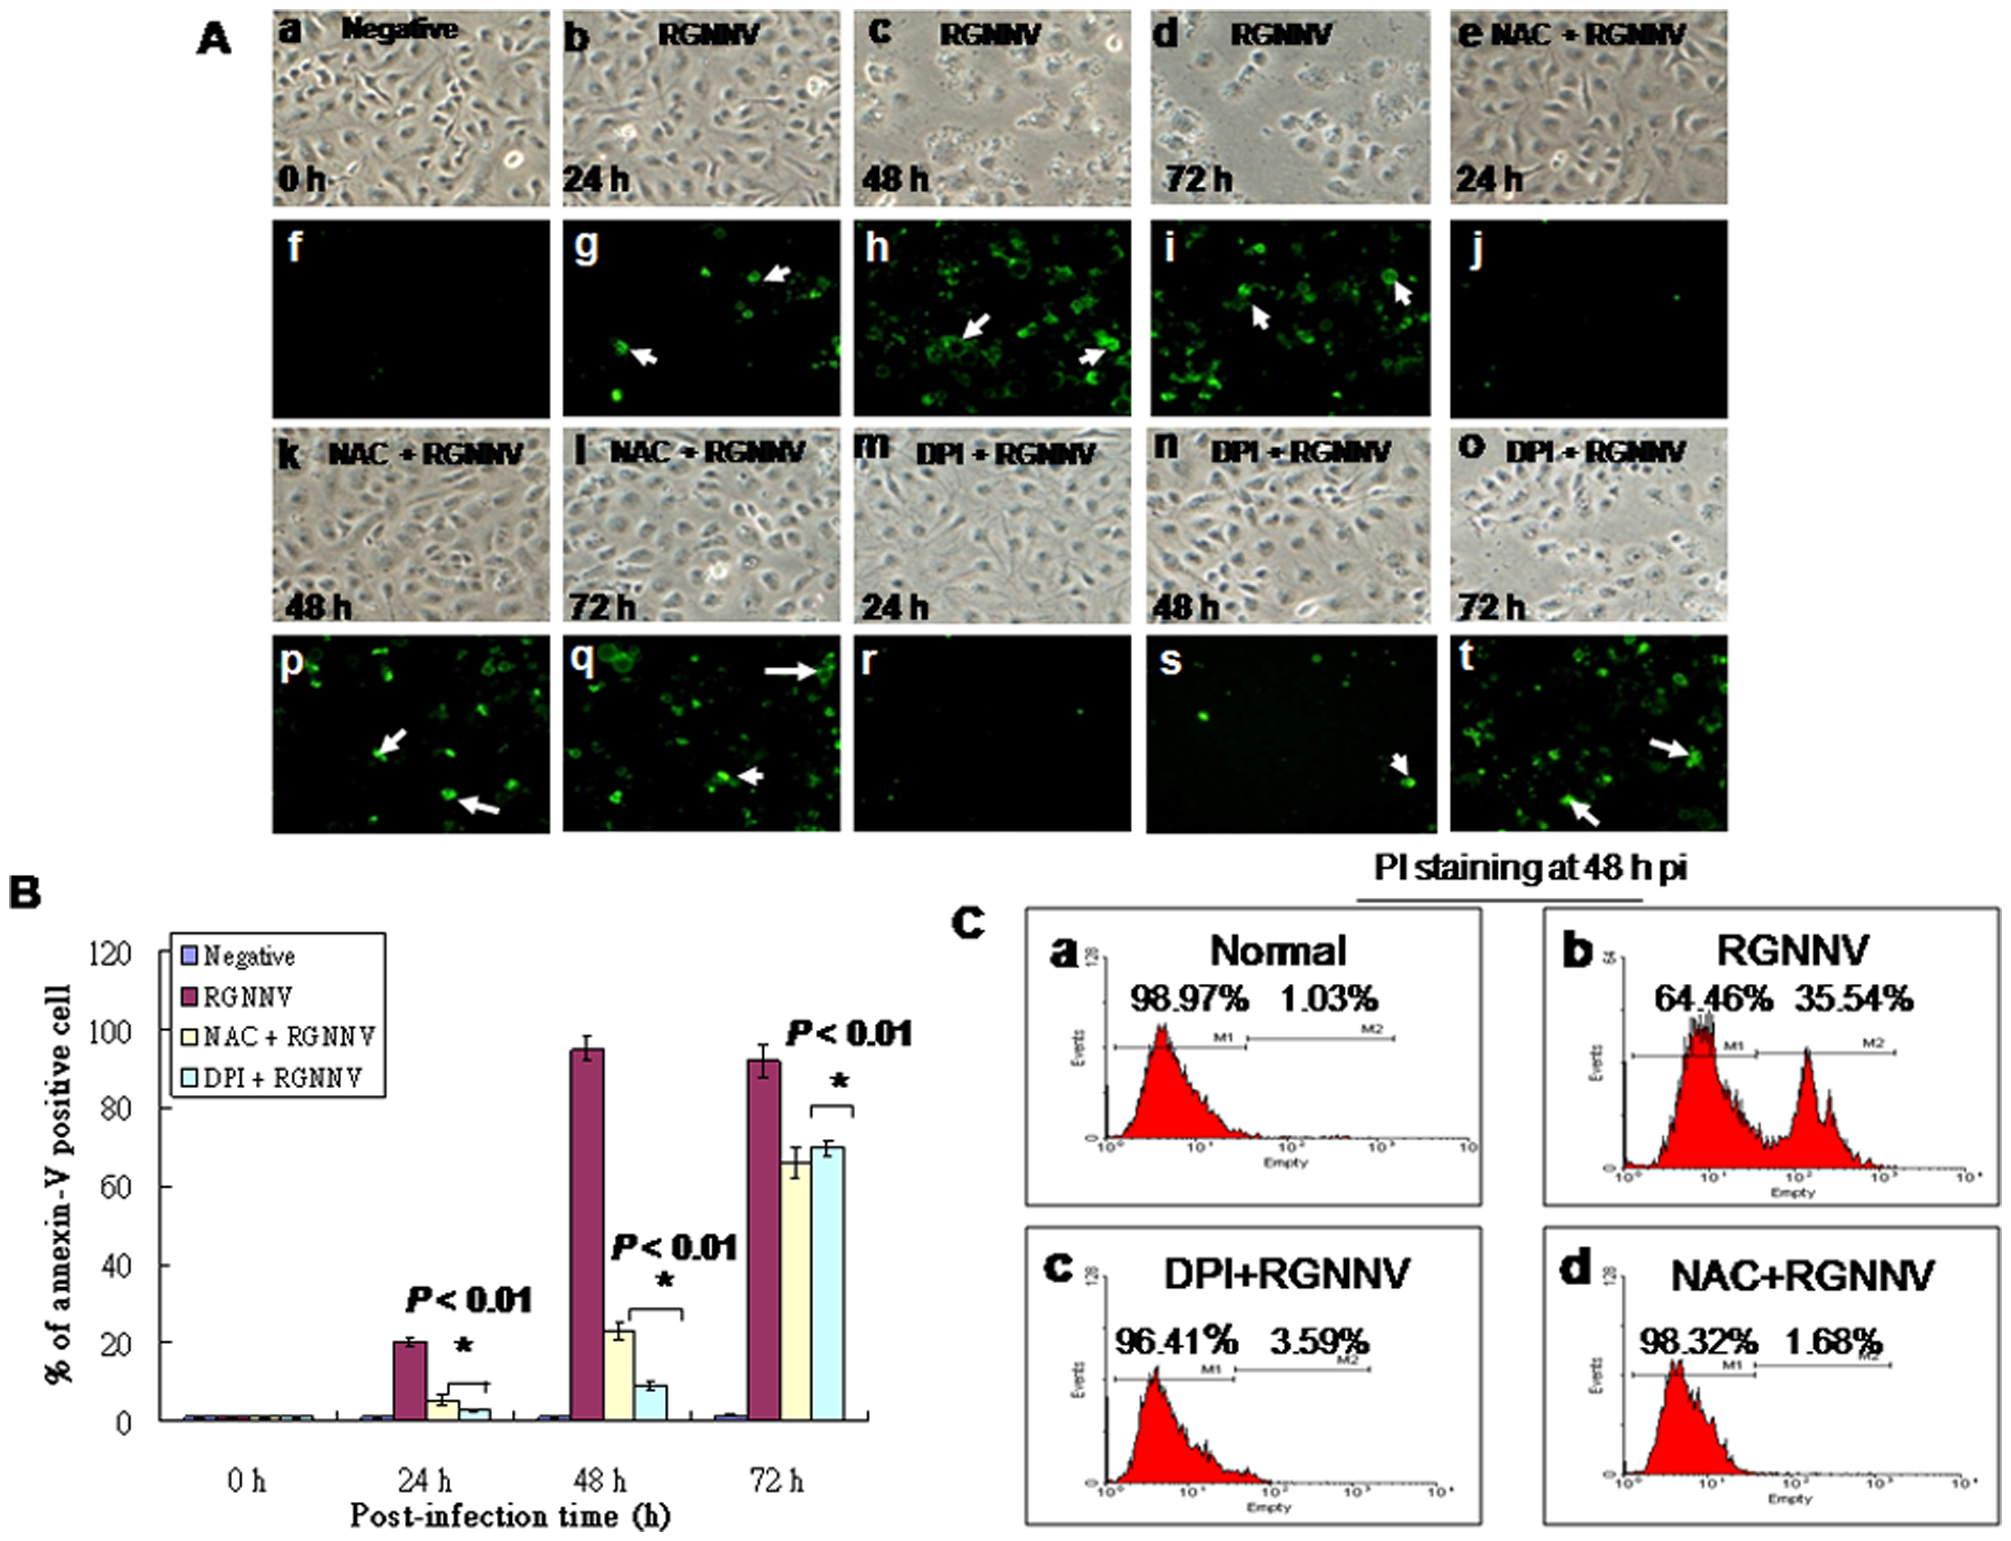
Fig. 4
Identification of anti-oxidants treatment can reduce apoptotic/necrotic death of cells infected with RGNNV.
(A) Phase-contrast and fluorescent micrographs of annexin-V–stained, RGNNV-infected GF-1 cells without drug-treatment at 0 h (a and f), 24 h (b and g), 48 h (c and h), and 72 h (d and i) or with NAC-treatment at 24 h (e and j), 48 h (k and p), and 72 h (l and q) and DPA-treatment at 24 h (m and r), 48 h (n and s), and 72 h (o and t). Annexin-V–positive cells (necrotic cells) are indicated by arrows. Scale bar = 20 μm. (B) The number of annexin-V–positive cells after infection with RGNNV at 0, 24, 48, and 72 h. Statistical comparisons were made using either a paired or unpaired Student′s t-test, as appropriate. *P<0.05. (C) Examples of flow cytometric profiles in 48 h pi. RGNNV-infected cell and plus anti-oxidants treatment cells PI staining fluorescence was measured from 10,000 cells. Numbers in second peak scales (PI+) show late apoptotic/secondary necrotic cell percentages respectively. Viable cell percentage (PI -) is shown in first peak.