
Image
|
Figure Caption
Fig. S3
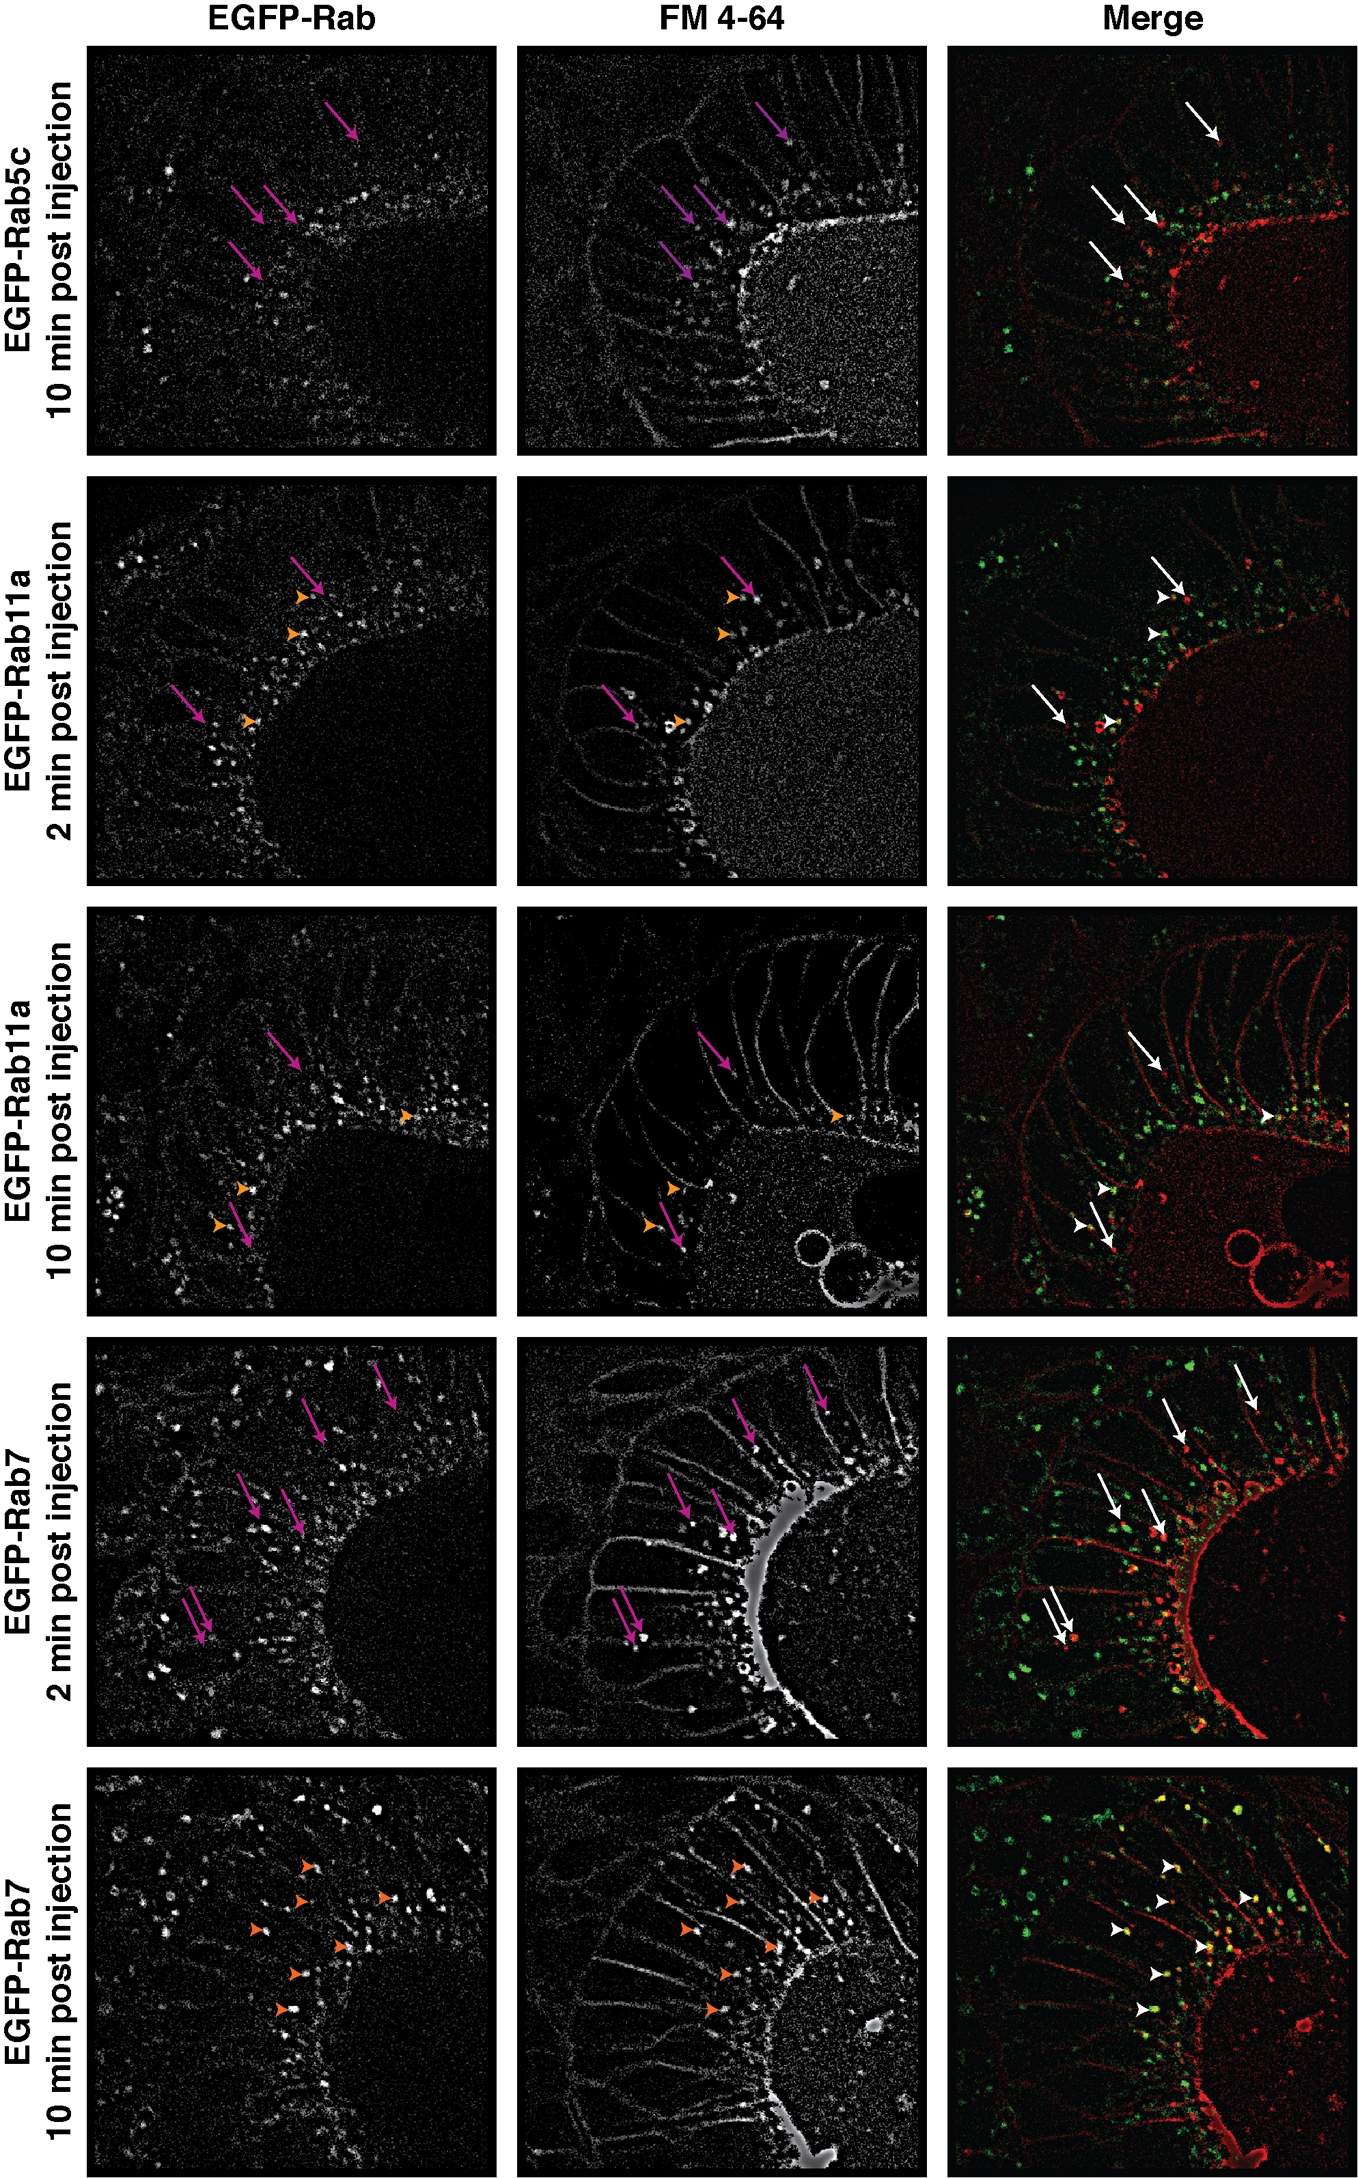
FM 4-64 lipophilic dye uptake assay examples. Additional examples of otic vesicle epithelial cells showing co-localization (arrowheads) of EGFP-Rab vesicles with internalized FM 4-64 dye at listed time-points. Arrows indicate regions where no co-localization was detected. Scale bars = 5 μm.
Acknowledgments
This image is the copyrighted work of the attributed author or publisher, and
ZFIN has permission only to display this image to its users.
Additional permissions should be obtained from the applicable author or publisher of the image.
Full text @ Dev. Dyn.