
|
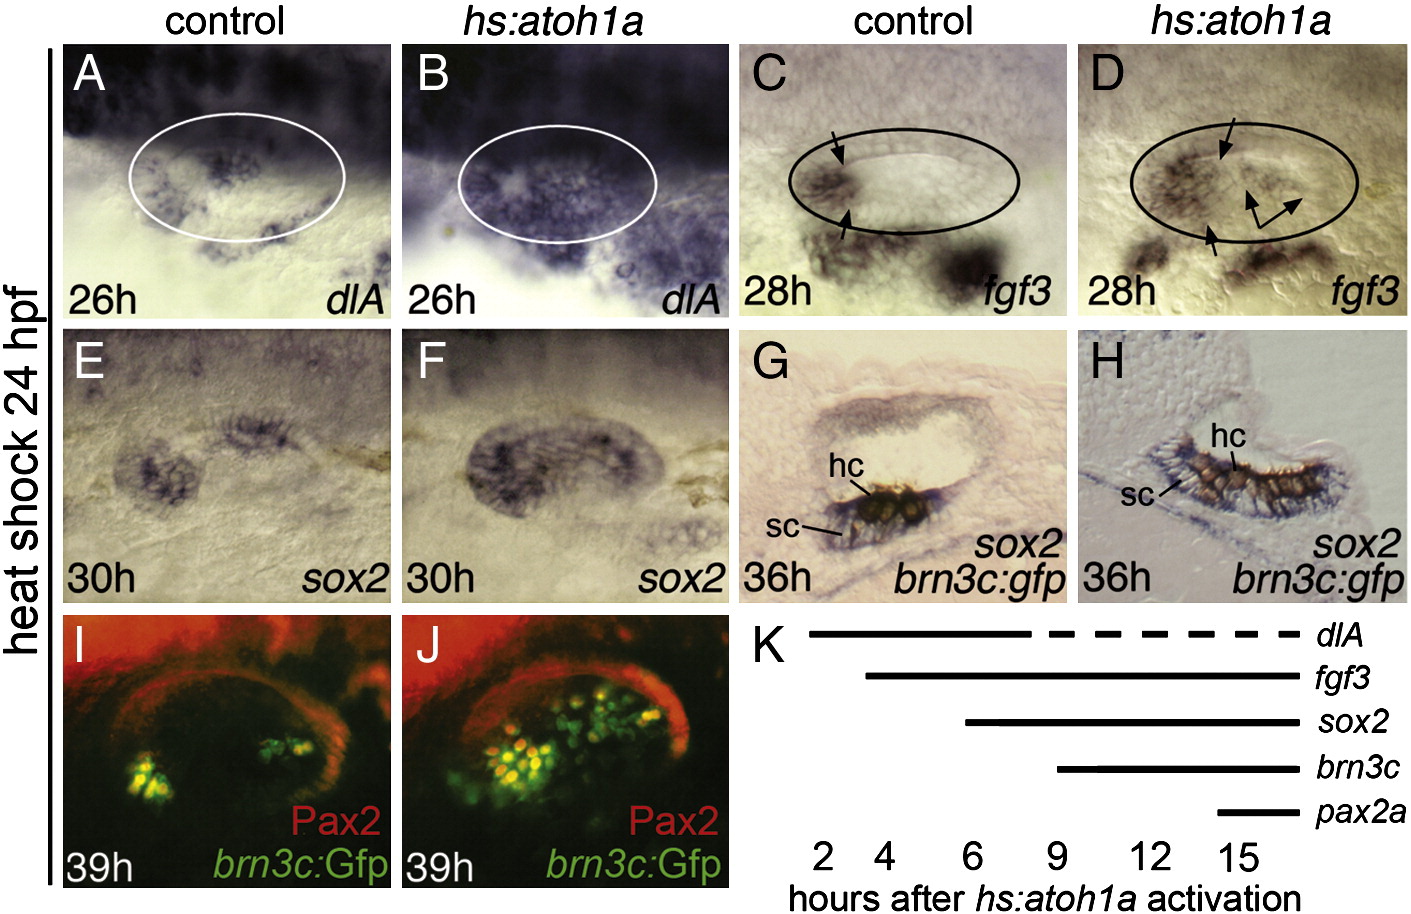
Fig. 3 Otic vesicle patterning following hs:atoh1a activation at 24 hpf. (A–F) Expression at the indicated times of dlA, fgf3 and sox2 in control embryos (A, C, E) and hs:atoh1a transgenic embryos (B, D, F). To assist in interpretation of images, otic vesicles are outlined in A–D and the spatial limits of fgf3 expression are marked by arrows (C, D). (G, H) Transverse sections showing expression of sox2 (blue) and anti-GFP (brown) at 36 hpf in a control embryo (G) and a hs:atoh1a transgenic embryo (H). Positions of hair cells (hc) and support cells (sc) are indicated. (I, J) Expression of brn3c:gfp (green) and Pax2 (red) in otic hair cells at 39 hpf in a control embryo (I) and a hs:atoh1a transgenic embryo (J). (K) Summary of the onset of expanded or ectopic expression of various otic markers following activation of hs:atoh1a at 24 hpf. Most markers were stably expressed, except for dlA. Expression of dlA was lost in a subset of cells after several hours, presumably reflecting the process of lateral inhibition. Images of wholemount specimens (A–F, I, J) are dorsolateral views with anterior to the left and dorsal to the top.
Reprinted from Developmental Biology, 358(1), Sweet, E.M., Vemaraju, S., and Riley, B.B., Sox2 and Fgf interact with Atoh1 to promote sensory competence throughout the zebrafish inner ear, 113-21, Copyright (2011) with permission from Elsevier. Full text @ Dev. Biol.