
|
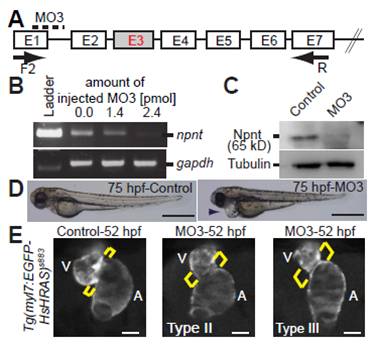
Fig. S1 Characterization of splice-inhibitory morpholino MO3-mediated Npnt knockdown. (A) Scheme of the splice-inhibitory effect of MO3. npnt exon E3 could not be detected by RT-PCR. (B) RT-PCR analysis of mRNAs from control and MO3-injected embryos at 52 hpf. (C) Western blot analysis of protein extracts from control and MO3-injected embryos at 52 hpf. (D) Lateral view of control and MO3-injected embryos at 75 hpf. MO3 injection resulted in pericardial edema (arrowhead). (E) MO3-injected embryos from transgenic Tg(myl7:EGFP-HsHRAS)s883 zebrafish showed an expansion of the AV canal at 52 hpf. Brackets indicate the AV boundary. A, atrium; V, ventricle. Scale bars: 500 μm in D; 50 μm in E.