
Image
|
Figure Caption
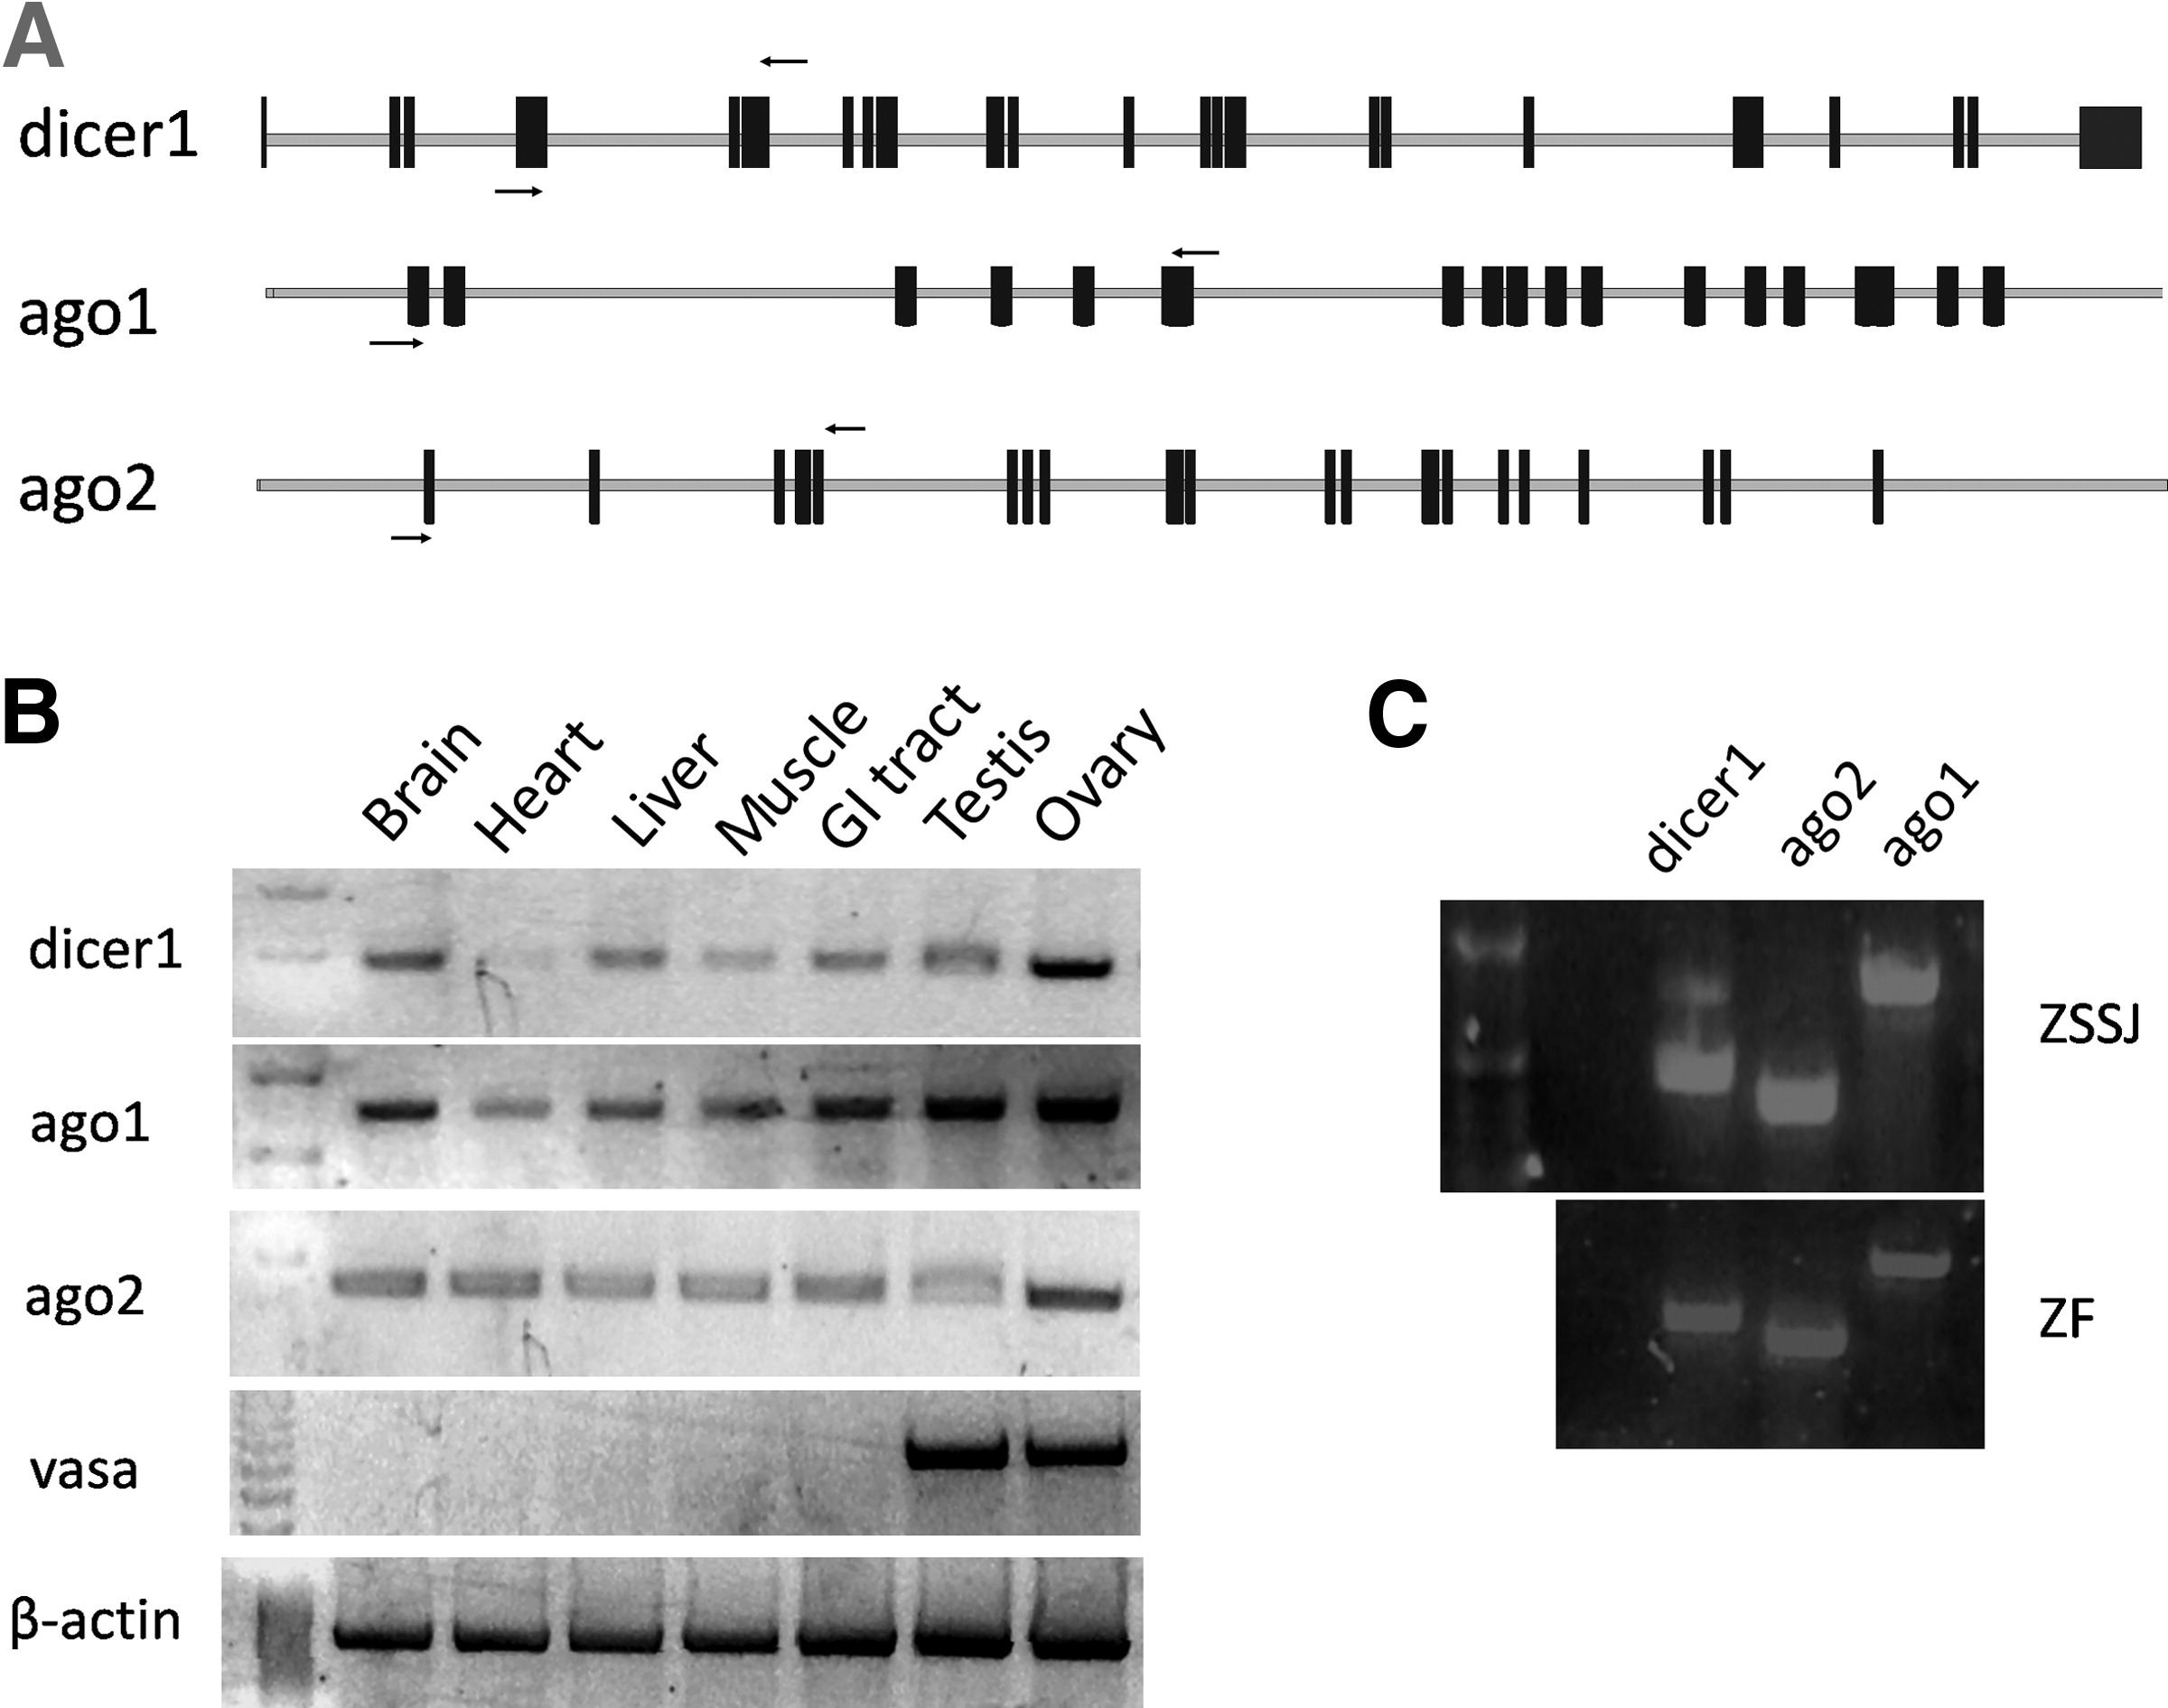
Fig. 2 ZSSJ and ZF cell lines express dicer1, ago1, and ago2. (A) Schematic showing the intron (line) and exon (box) organization of zebrafish dicer1, ago1, and ago2 and the location of primers (arrows) used for RT-PCR analysis. Primers were designed to amplify exons 6 and 9 of dicer1; 1 and 6 of ago1 and 1 and 4 of ago2. (B) RT-PCR analysis of dicer1, ago1, and ago2 expression in adult zebrafish tissues and (C) ZSSJ and ZF cell cultures. β-actin was used as a positive control and vasa as a gonad-specific control.
Acknowledgments
This image is the copyrighted work of the attributed author or publisher, and
ZFIN has permission only to display this image to its users.
Additional permissions should be obtained from the applicable author or publisher of the image.
Full text @ Zebrafish