
Image
|
Figure Caption
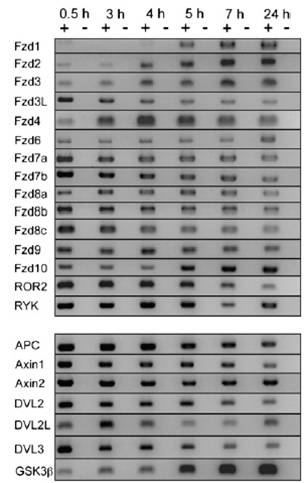
Fig. S7 RT-PCR analysis of the expression of Wntreceptors and downstreamcomponents of the canonicalWntsignaling pathway. Expression of theWntreceptors (Fzd1, Fzd2, Fzd3, Fzd3L, Fzd4, Fzd6, Fzd7a, Fzd7b, Fzd8a, Fzd8b, Fzd9, Fzd10, ROR2, RYK) and of downstreamcomponents (APC, Axin1, Axin2, DVL2, DVL2L, DVL3, GSK3b) analyzed by RT-PCR at one- to two-cell stage (0.5 h), 1,000-cell stage (3 h), sphere stage (4 h), 40% epiboly (5 h), 60% epiboly (7 h), and at 24 hpf.
Acknowledgments
This image is the copyrighted work of the attributed author or publisher, and
ZFIN has permission only to display this image to its users.
Additional permissions should be obtained from the applicable author or publisher of the image.
Full text @ Proc. Natl. Acad. Sci. USA