
|
Fig. S6
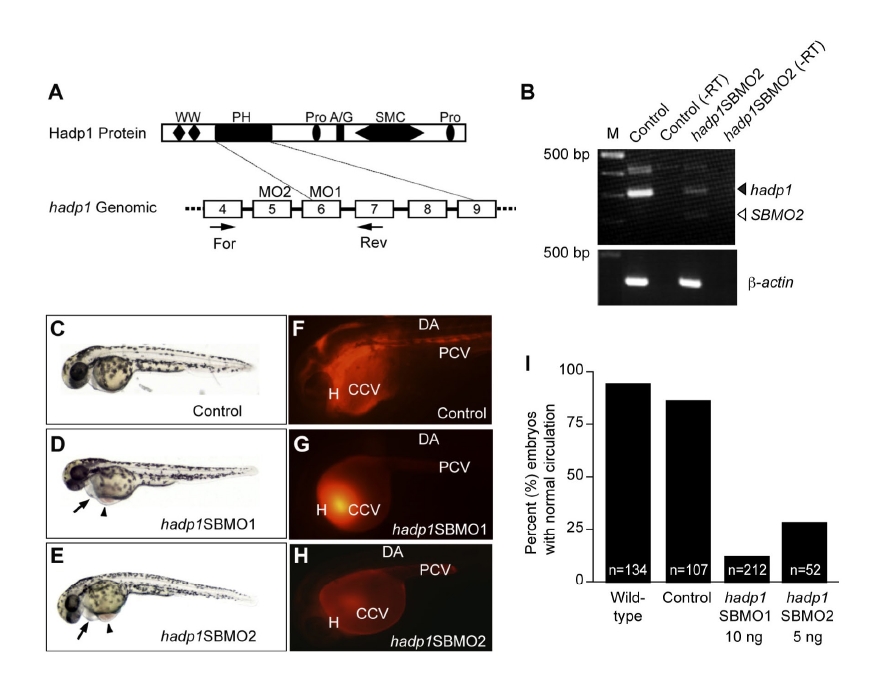
Knockdown by a second, non-overlapping MO decreases levels of WT hadp1 mRNA and results in similar circulation defects as hadp1SBMO1. (A-B) Schematic representation of Hadp1 protein and partial genomic structure (boxes represent coding exons), with positions of the MO and RT-PCR primers indicated. (B) Agarose gel images show RT-PCR results for hadp1 message and β-actin as a loading control. -RT indicates RT without reverse transcriptase as a negative control. DNA ladder sizes are indicated in basepairs. (C-E) Brightfield images of live embryos anterior to left show overall trunk morphology in control (10 ng control MO) and hadp1 morphants (10 ng hadp1SBMO1, 5ng hadp1SBMO1, hadp1SBMO2). (F-H) Microangiography was performed following injection of hadp1SBMO1, hadp1SBMO2 or control MO. Circulation was scored by microangiography, or under transmitted light, and the results are quantified in (I). All embryos are imaged from a lateral view, anterior to left. The heart (H), common cardinal vein (CCV), dorsal aorta (DA), and posterior cardinal vein (PCV) are indicated.