
|
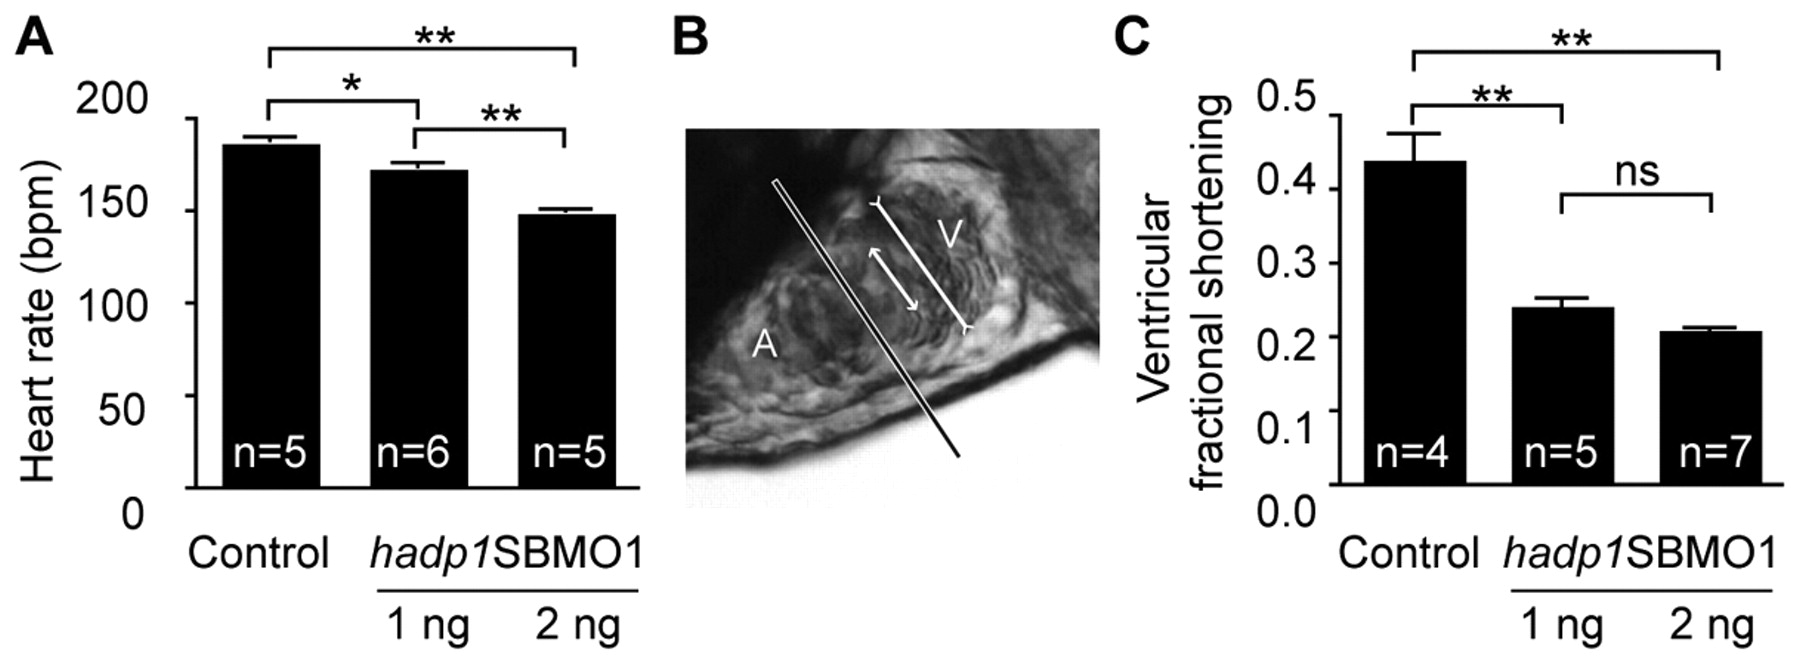
Fig. 3
Loss of hadp1leads to bradycardia and hypocontractility. (A) Heart rate analysis (bpm) in control and hadp1 morphants at 48 hpf and 21°C. (B) Live, lateral image of a 48-hpf zebrafish heart. The longest line represents the demarcation between the atrium (A) and ventricle (V), whereas the long line in the ventricle represents the end diastolic, or largest area, of the ventricular chamber and the shorter line represents the end systolic, or smallest, ventricular area. The ratio of these two measurements defines ventricular fractional shortening. (C) Analysis of ventricular fractional shortening following loss of hadp1. See supplementary material Movies 3, 4 and 5 for the absence of edema, unlike SBMO1 (10 ng)-injected animals (as shown in Fig. 2 and supplementary material Movies 1 and 2). *Pd0.05; **Pd0.005; ***Pd0.001; ns, not significant.