
|
Fig. 4
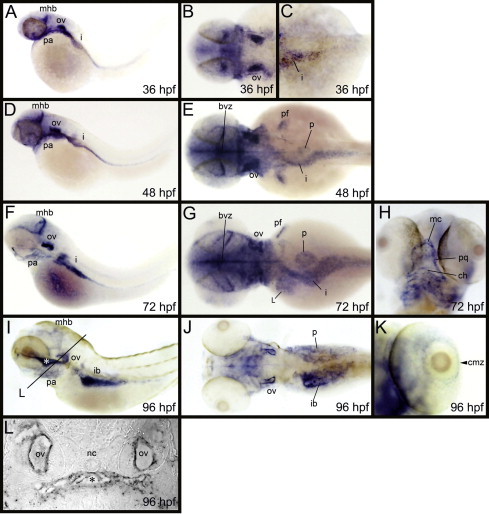
Expression patterns of lgr4 in zebrafish larvae. (A–K) lgr4 expression was examined by whole-mount in situ hybridization at 36, 48, 72, and 96 hpf. Lateral views, anterior to the left (A, D, F, and I). Dorsal views, anterior to the left (B, C, E, G, and J). A ventral view of (F and G) (H). A magnified view of the eye in (I and J) (K). (L) A transverse section showing the lgr4 expression. The transverse section was cut at the level indicated by a black line in (I). Asterisks indicate the cranial cavity; arrowhead indicates the ciliary marginal zone. bvz, brain ventricular zone; ch, ceratohyals; cmz, ciliary marginal zone; i, intestine; ib, intestinal bulb; L, liver; mc, Meckel’s cartilages; mhb, midbrain–hindbrain boundary; nc, notochord; ov, otic vesicles; p, pancreas; pa, pharyngeal arches; pf, pectoral fin buds; pq, palatoquadrates.
Reprinted from Gene expression patterns : GEP, 11(7), Hirose, K., Shimoda, N., and Kikuchi, Y., Expression patterns of lgr4 and lgr6 during zebrafish development, 378-83, Copyright (2011) with permission from Elsevier. Full text @ Gene Expr. Patterns