
Image
|
Figure Caption
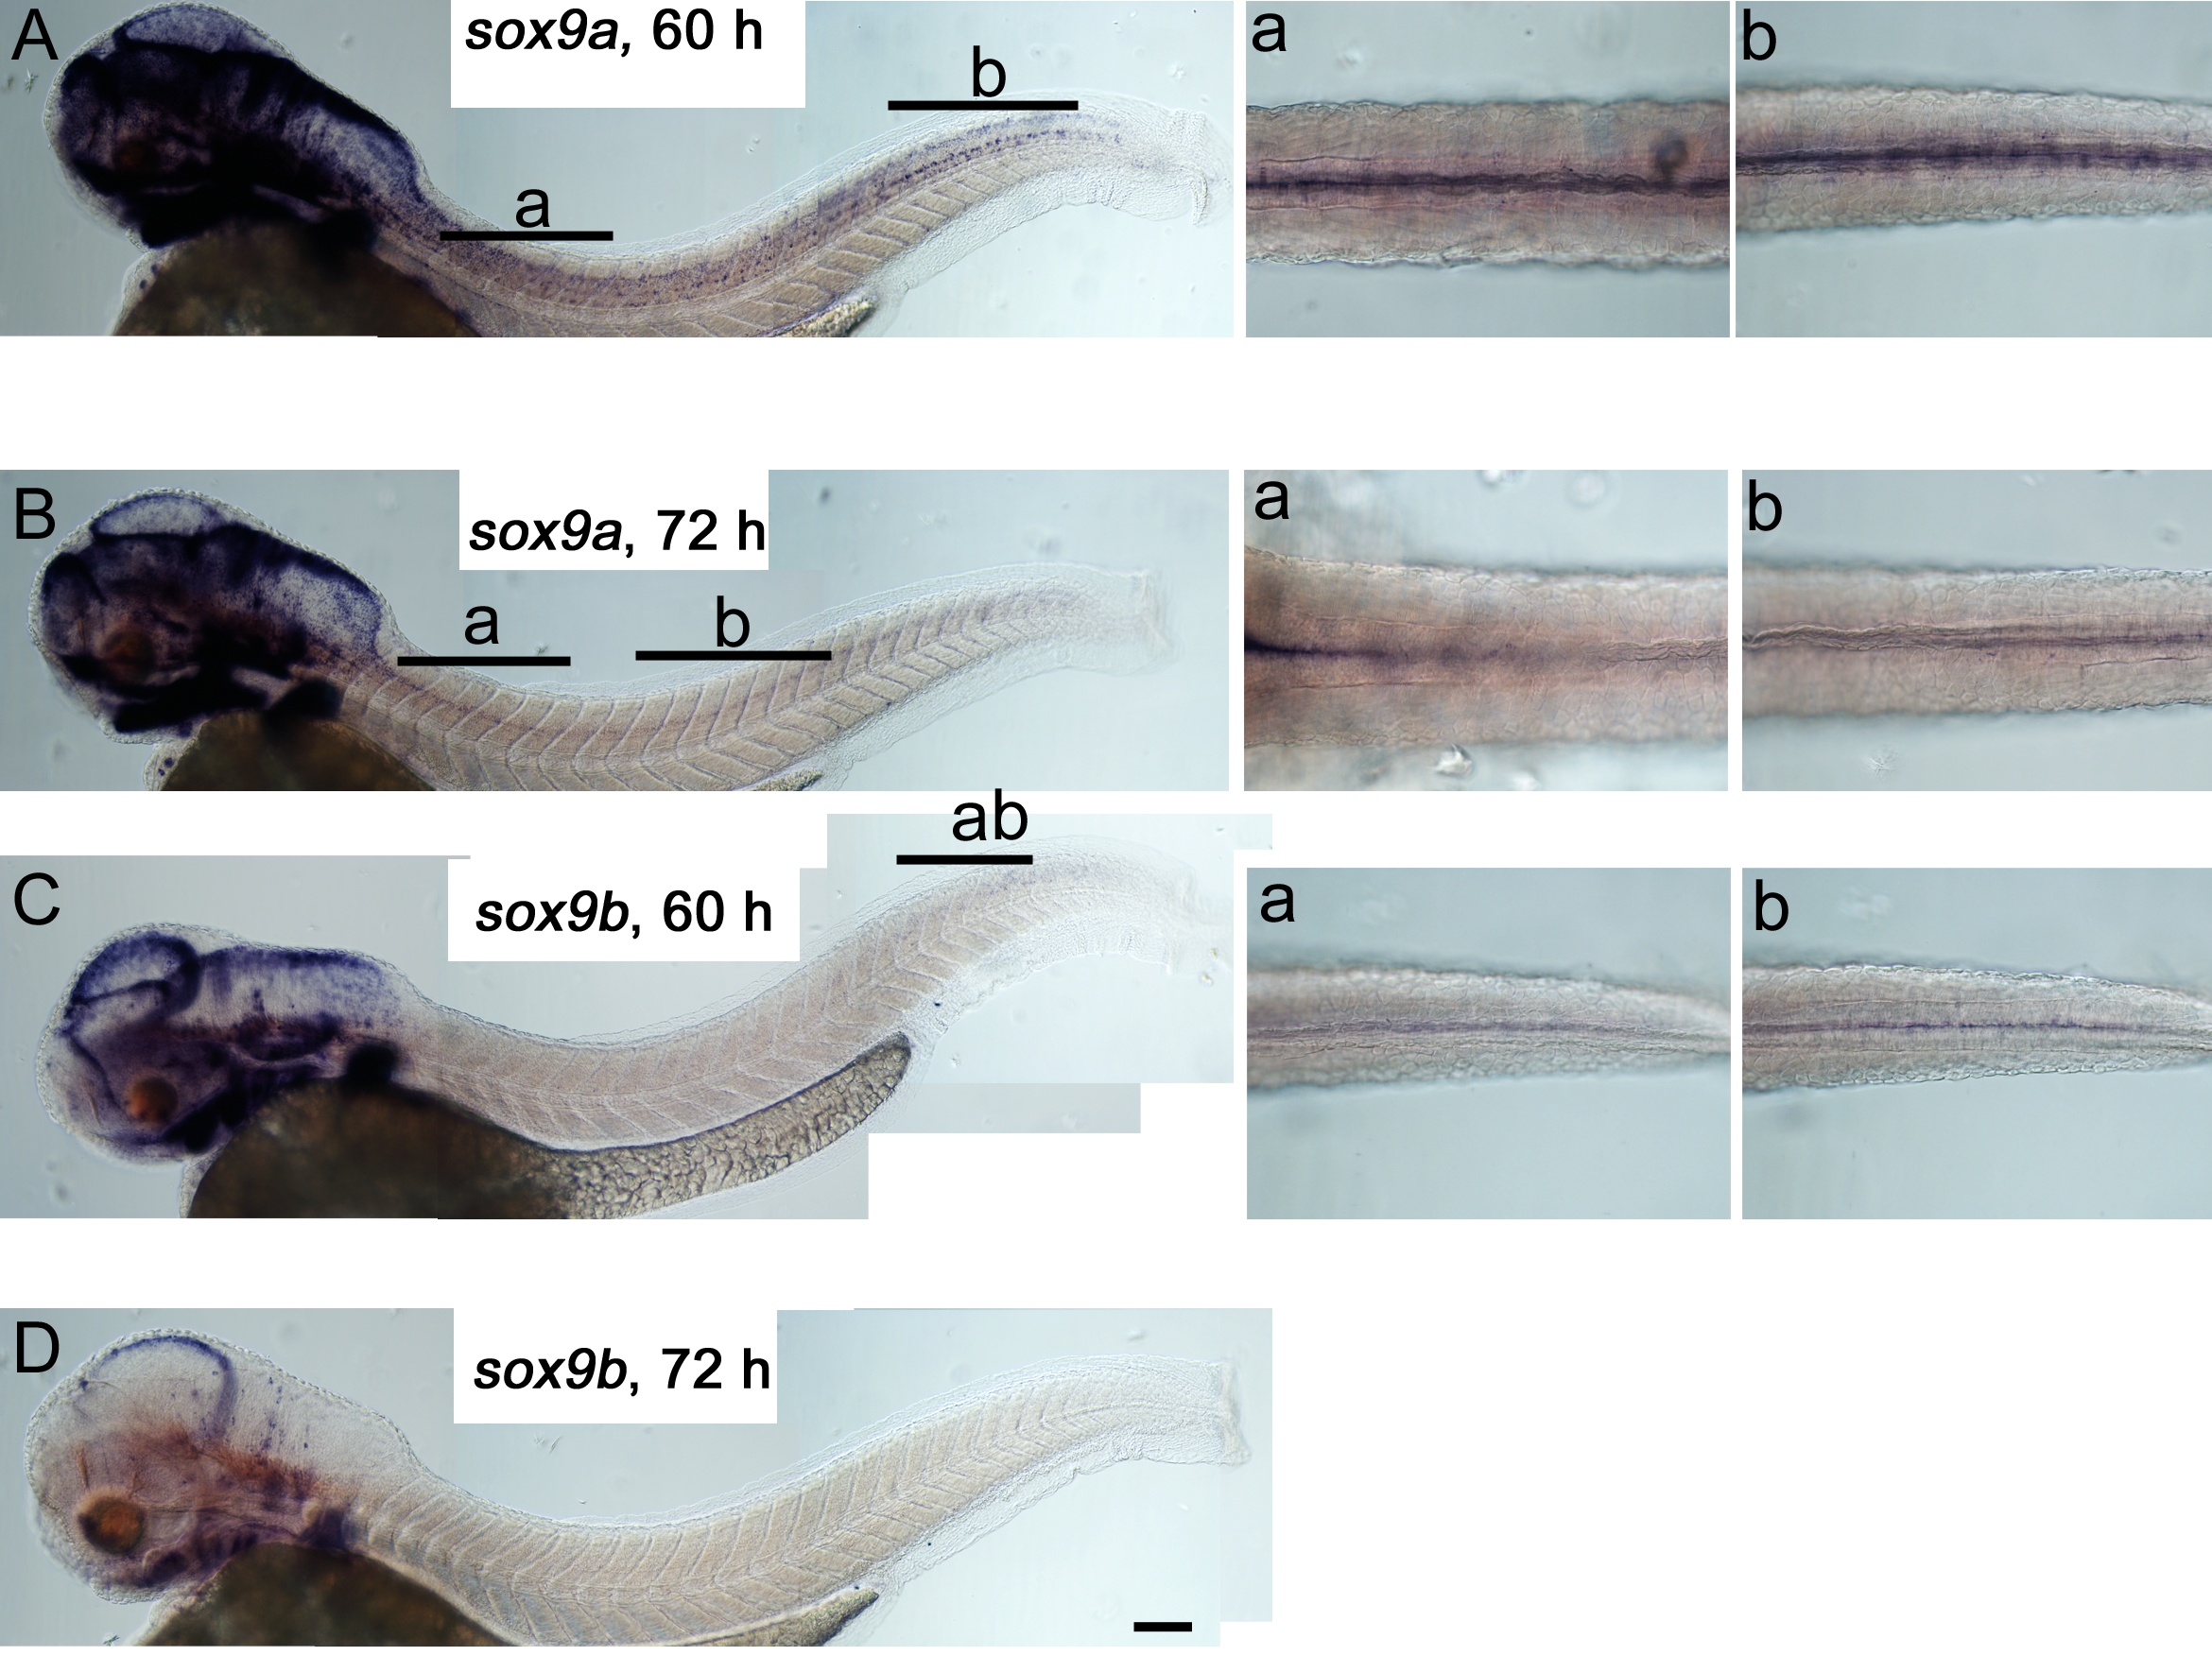
Fig. S1
Neither sox9a nor sox9b are expressed in differentiated melanocytes. Lateral views of whole embryos (left) and dorsal views of dorsal stripe region (insets right, location indicated by lettered bars) show 60 hpf (A,C) and 72 hpf (B, D) embryos. In C, inset b shows a deeper focal plane than that in inset a. Embryos were treated with PTU to allow detection of even very weak signals. Scale bar 100 μm.
Figure Data
Acknowledgments
This image is the copyrighted work of the attributed author or publisher, and
ZFIN has permission only to display this image to its users.
Additional permissions should be obtained from the applicable author or publisher of the image.
Full text @ PLoS Genet.