
Fig. S3
- ID
- ZDB-IMAGE-110928-23
- Publication
- Culbertson et al., 2011 - Chondrogenic and Gliogenic Subpopulations of Neural Crest Play Distinct Roles during the Assembly of Epibranchial Ganglia
- All Figures
- Figures for Culbertson et al., 2011
|
Fig. S3
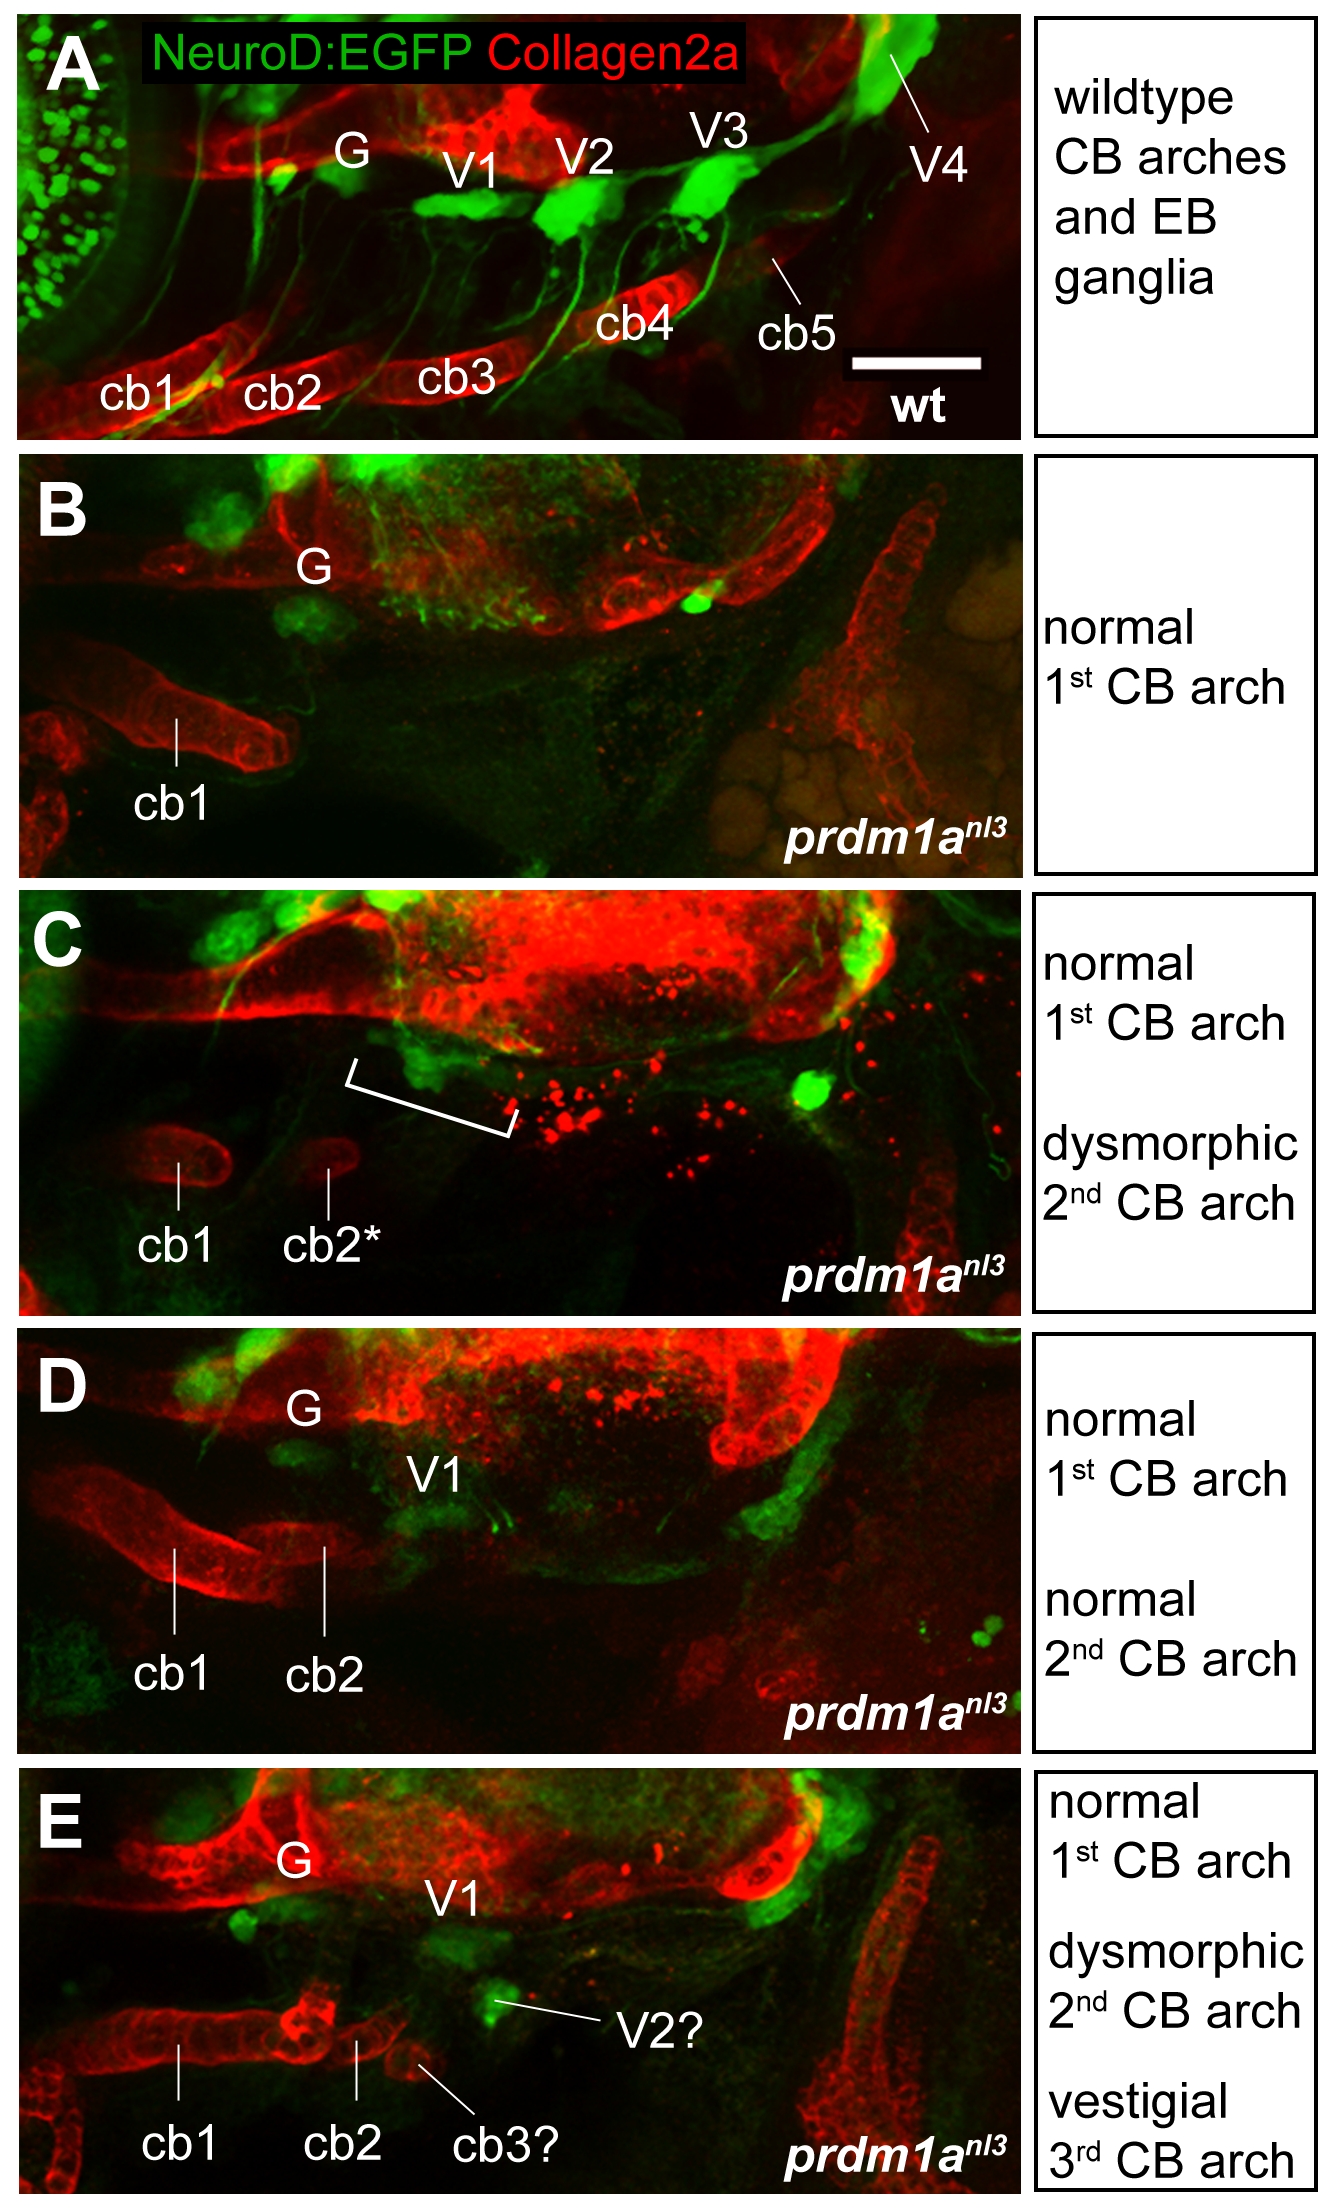
Relationship between CB arches and EB ganglia formation in prdm1anl3 mutants. (A) Composite lateral view of EB ganglia visualized with Tg(neuroD:EGFP)nl1 transgene (green) alongside cartilaginous CB arches stained for Collagen2a (red) in a 4 dpf wildtype larva. Fluoresence demonstrates spatial association of the first ceratobranchial arch with the glossopharyngeal ganglion and the second through fifth ceratobranchial arches with the first through fourth vagal ganglia, respectively. (B–E) Composite lateral views of prdm1anl3 mutant larvae exhibiting different degrees of CB arch formation. (B) A single, normally-formed first CB ventral to a cluster of EGFP-positive cells that corresponds to the glossopharyngeal ganglion. Note the absence of other small ganglia. (C) Normally-formed first CB arch alongside a dysmorphic second ceratobranchial arch. A fused ganglion structure is visible dorsal to the arches (bracket). (D) Normal formation of first and second CB arches. Distinct glossopharyneal and first vagal ganglia are positioned dorsal to the arch bodies. (E) Normally-formed first CB arch with dysmorphic second arch and presumptive third arch vestige. As in D, distinct glossopharygeal and first vagal ganglia are visible dorsal to arch structures. In addition, a small EGFP-positive cluster of cells can be seen between the arches and ganglia. Abbreviations: G = glossopharyngeal ganglion; V1–V4 = first through fourth vagal ganglia; cb1–cb5 = ceratobranchial arches 1–5. Scale bar = 50 μm.