
Image
|
Figure Caption
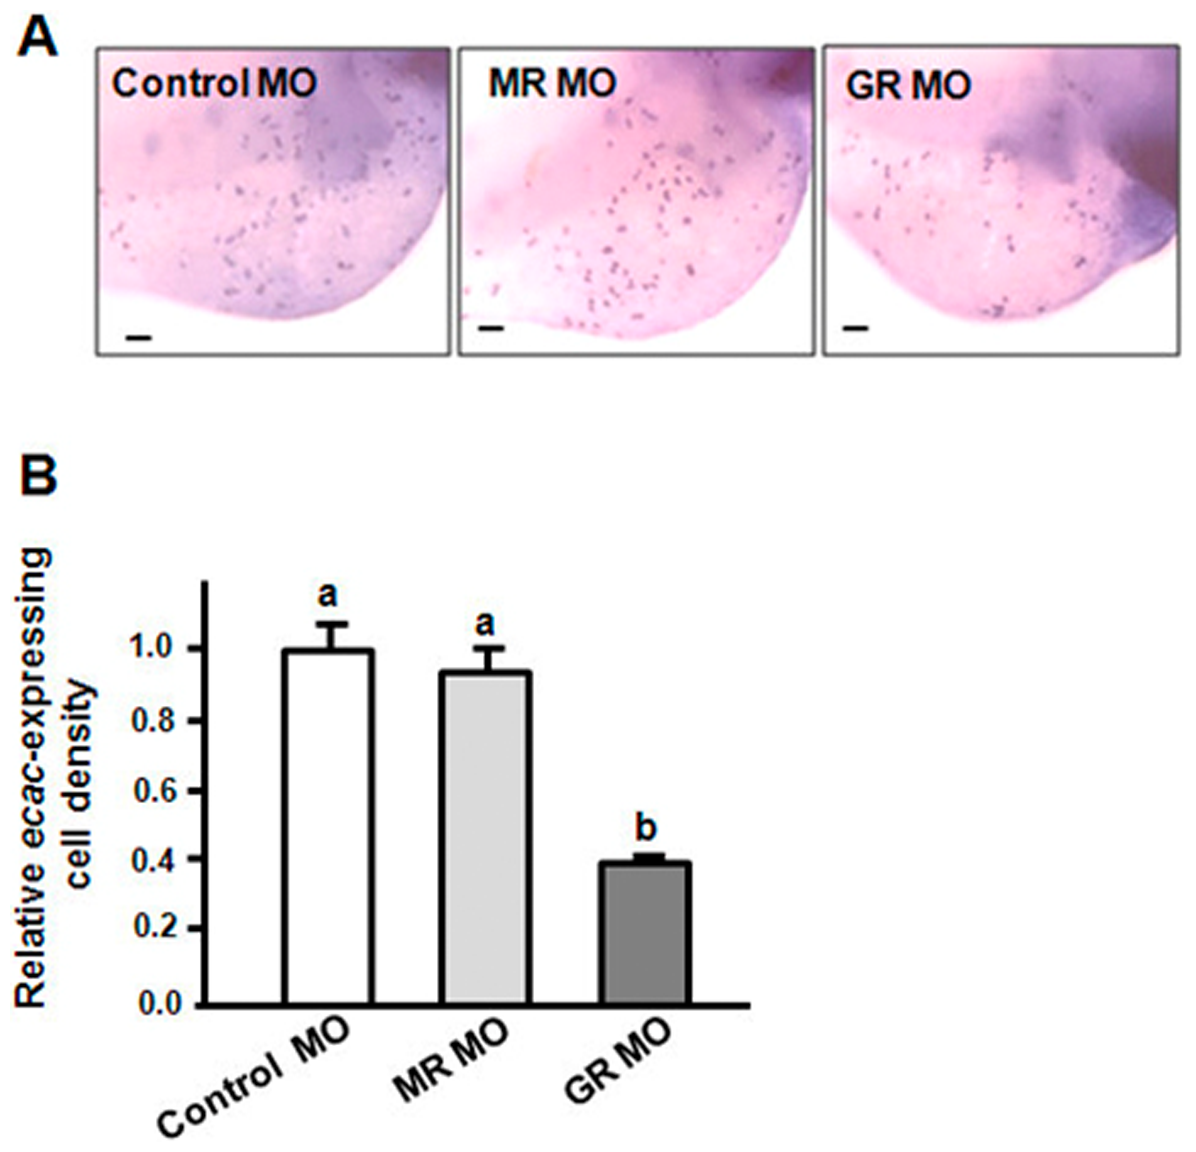
Fig. 7
Effects of MR MO and GR MO on ecac-expressing cells in 3-dpf zebrafish embryos.
In situ hybridization analysis indicated ecac signals (A) and density of ecac-expressing cells (B). abcIndicate a significant difference (p<0.05) using Tukey′s multiple-comparison test following one-way ANOVA. Value are the mean ± SEM (n = 6 or 7). Scale bar 100 μm.
Figure Data
Acknowledgments
This image is the copyrighted work of the attributed author or publisher, and
ZFIN has permission only to display this image to its users.
Additional permissions should be obtained from the applicable author or publisher of the image.
Full text @ PLoS One