
|
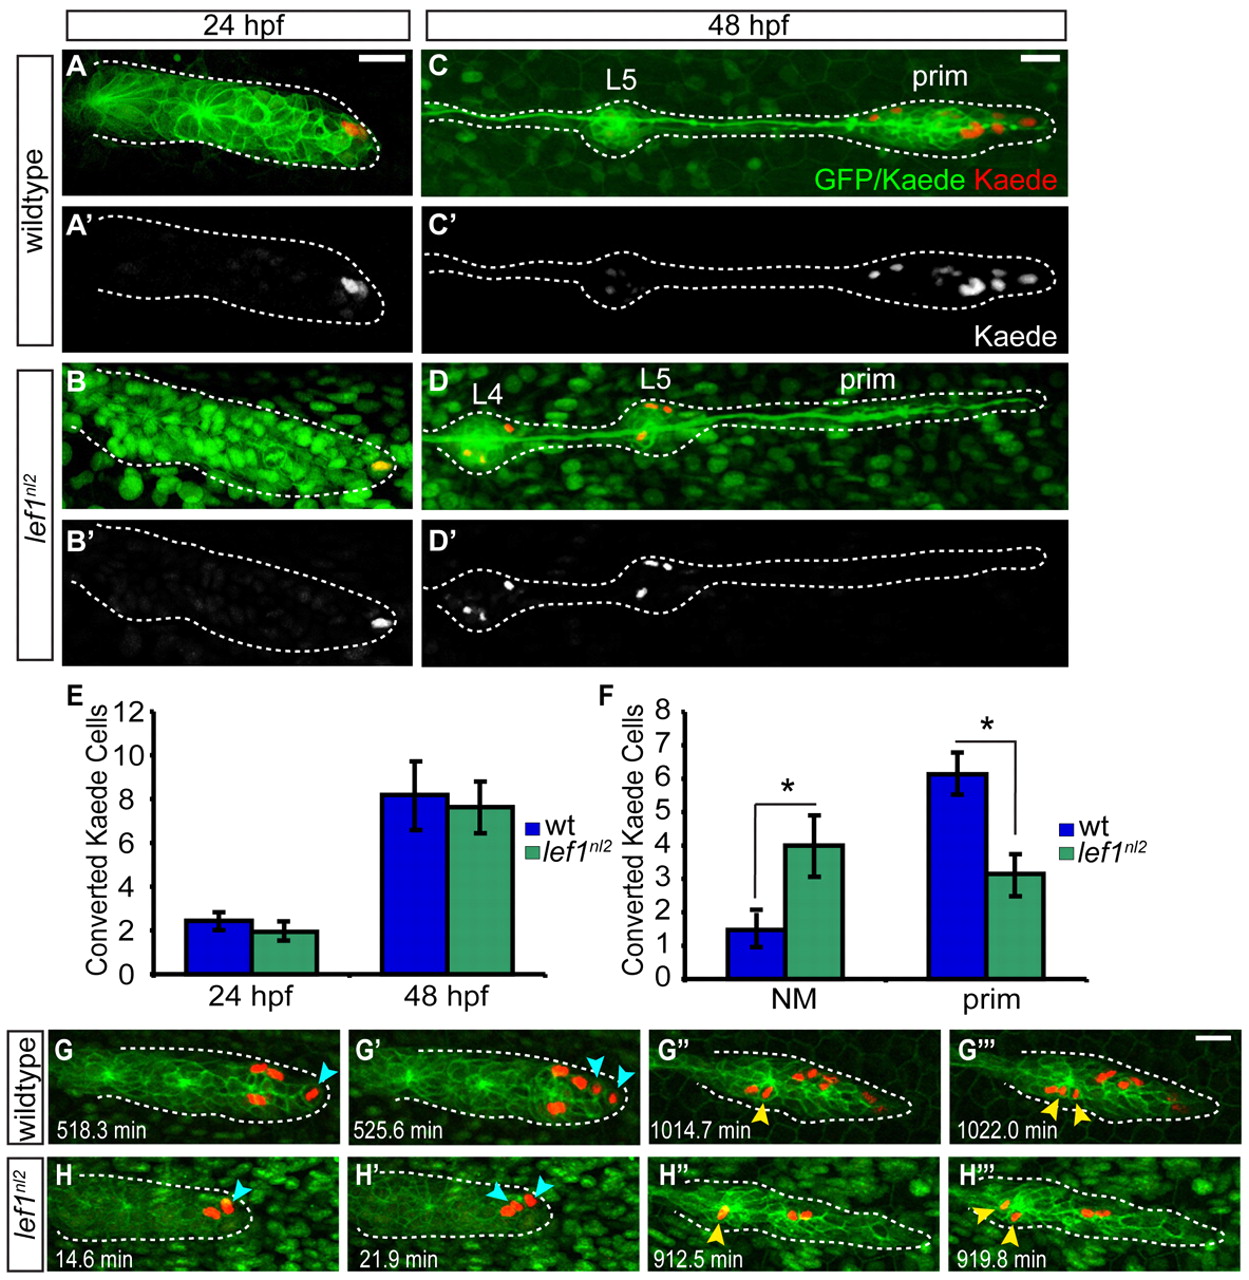
Fig. 7
Leading region cells change their fate in the absence of Lef1 function. (A-C′) Tg(–8.0cldnb:lynGFP) zygotes were injected with a nuclear-localized Kaede mRNA and an average of two cells were photoconverted at 24 hpf. (A,B) Wild-type and lef1nl2 mutant embryos immediately following photoconversion are shown. (C-D′) The embryos in A-B′ at 48 hpf showing the location of the progeny of the photoconverted cells. Note absence of the labeled (red) cells in the leading region of lef1nl2 mutant embryos. (E) Quantification of converted cells at 24 hpf and their progeny at 48 hpf. (F) Localization of converted cells at 48 hpf in wild-type and lef1nl2 mutants. Cells in lef1nl2 mutants are significantly more likely to be localized in NMs and not in the primordia when compared with wild type (mean±s.e.m., n=27 wild-type and 16 lef1nl2 mutant embryos, *P<0.04, Student′s t-test). (G-H′′) Still images from time-lapse movies (see Movies 3 and 4 in the supplementary material) demonstrating division of Kaede-positive cells (red) in a wild-type (G-G′′) and a lef1nl2 embryos (H-H′′). Specific time points were chosen to show a subset of labeled cells just before and after cell divisions. Leading zone divisions marked by blue arrows, whereas cell divisions in rosettes are marked by yellow arrowheads. Scale bars: 20 μm.