
|
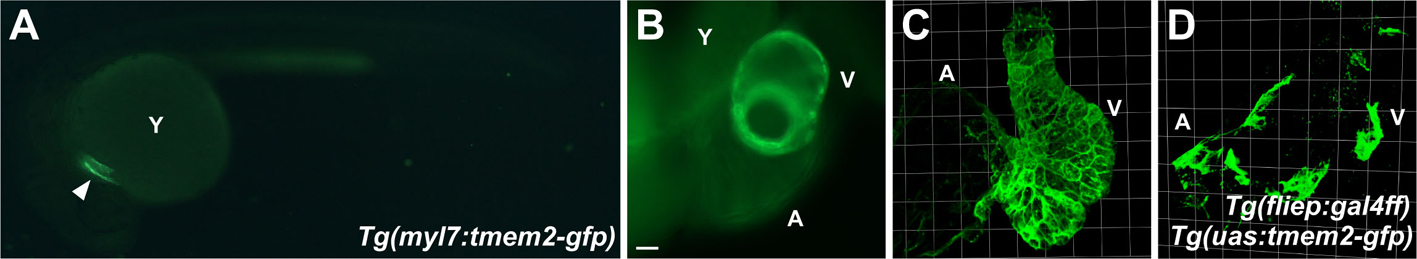
Fig. S6
Expression patterns of the Tg(myl7:tmem2-gfp), Tg(fliep:gal4ff) and Tg(uas:tmem2-gfp) transgenes. (A) Lateral view of a live embryo at 24 hpf expressing the stably integrated transgene Tg(myl7:tmem2-gfp), in which tmem2-gfp expression is driven by the myl7 promoter (Huang et al., 2003). Expression is detected only in the myocardium (arrowhead). Faint autofluorescence is visible in the yolk (Y). (B) Ventricular view of a live heart at 57 hpf expressing the stably integrated transgene Tg(myl7:tmem2-gfp) throughout the myocardium. (C) Three-dimensional confocal reconstruction of a live heart at 57 hpf expressing the stably integrated transgene Tg(myl7:tmem2-gfp) demonstrates localization of GFP to the plasma membrane. (D) Three-dimensional confocal reconstruction of a live heart at 57 hpf expressing the stably integrated transgenes Tg(fliep:gal4ff) and Tg(uas:tmem2-gfp) demonstrates mosaic expression in the ventricular and atrial endocardium. This degree of mosaicism was adequate for examining rescue of the ventricular endocardium in zygotic frv mutants (see Fig. 3J-O). However, evaluation of whether endocardial expression of tmem2 can rescue cardiac fusion in MZfrv mutants will require future development of less mosaic Tg(uas:tmem2-gfp) lines. Scale grids are 23 μm per segment. Scale bar: 50 μm.