
|
Fig. S10
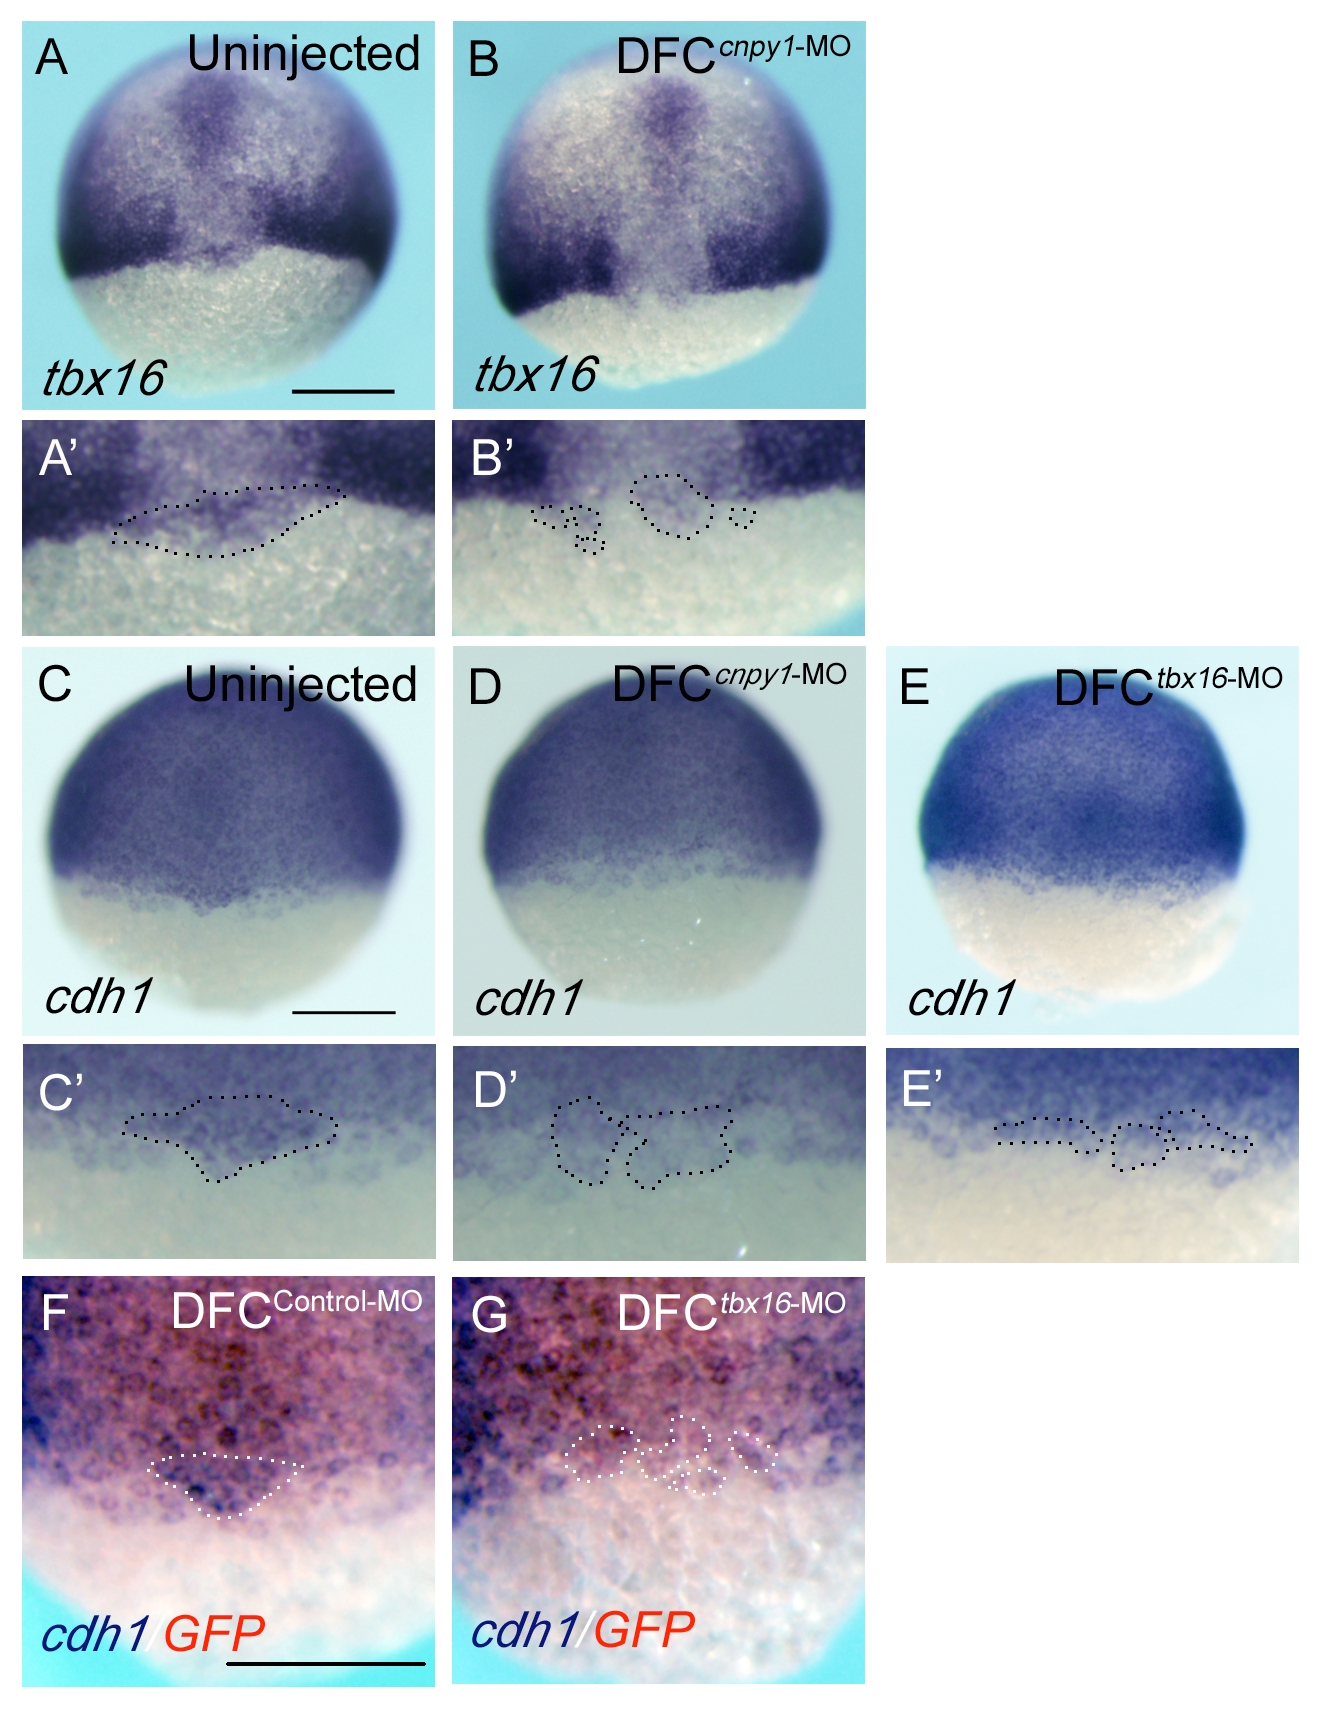
A genetic cascade including tbx16 and cdh1 mediates FGF signaling in DFCs. (A, B) Dorsal view of tbx16 expression in uninjected (A) or DFCcnpy1-MO (B) embryos at 65% epiboly stage. Scale bar: 200 μm. (C-E) Dorsal view of cdh1 expression in uninjected (C), DFCcnpy1-MO-injected (D) or DFCtbx16-MO-injected (E) embryos at 65% epiboly stage. Scale bar: 200 μm. (A′-E′) Higher-magnification images highlight DFCs. (F, G) cdh1 (purple) and GFP (red) expression in DFCcontrol-MO-injected (F) or DFCtbx16-MO-injected (G) Tg[sox17:GFP] embryos at 60% epiboly stage. Scale bar: 200 μm. Dotted lines in panels A′-E′, F and G mark the outlines of the DFC populations.