
|
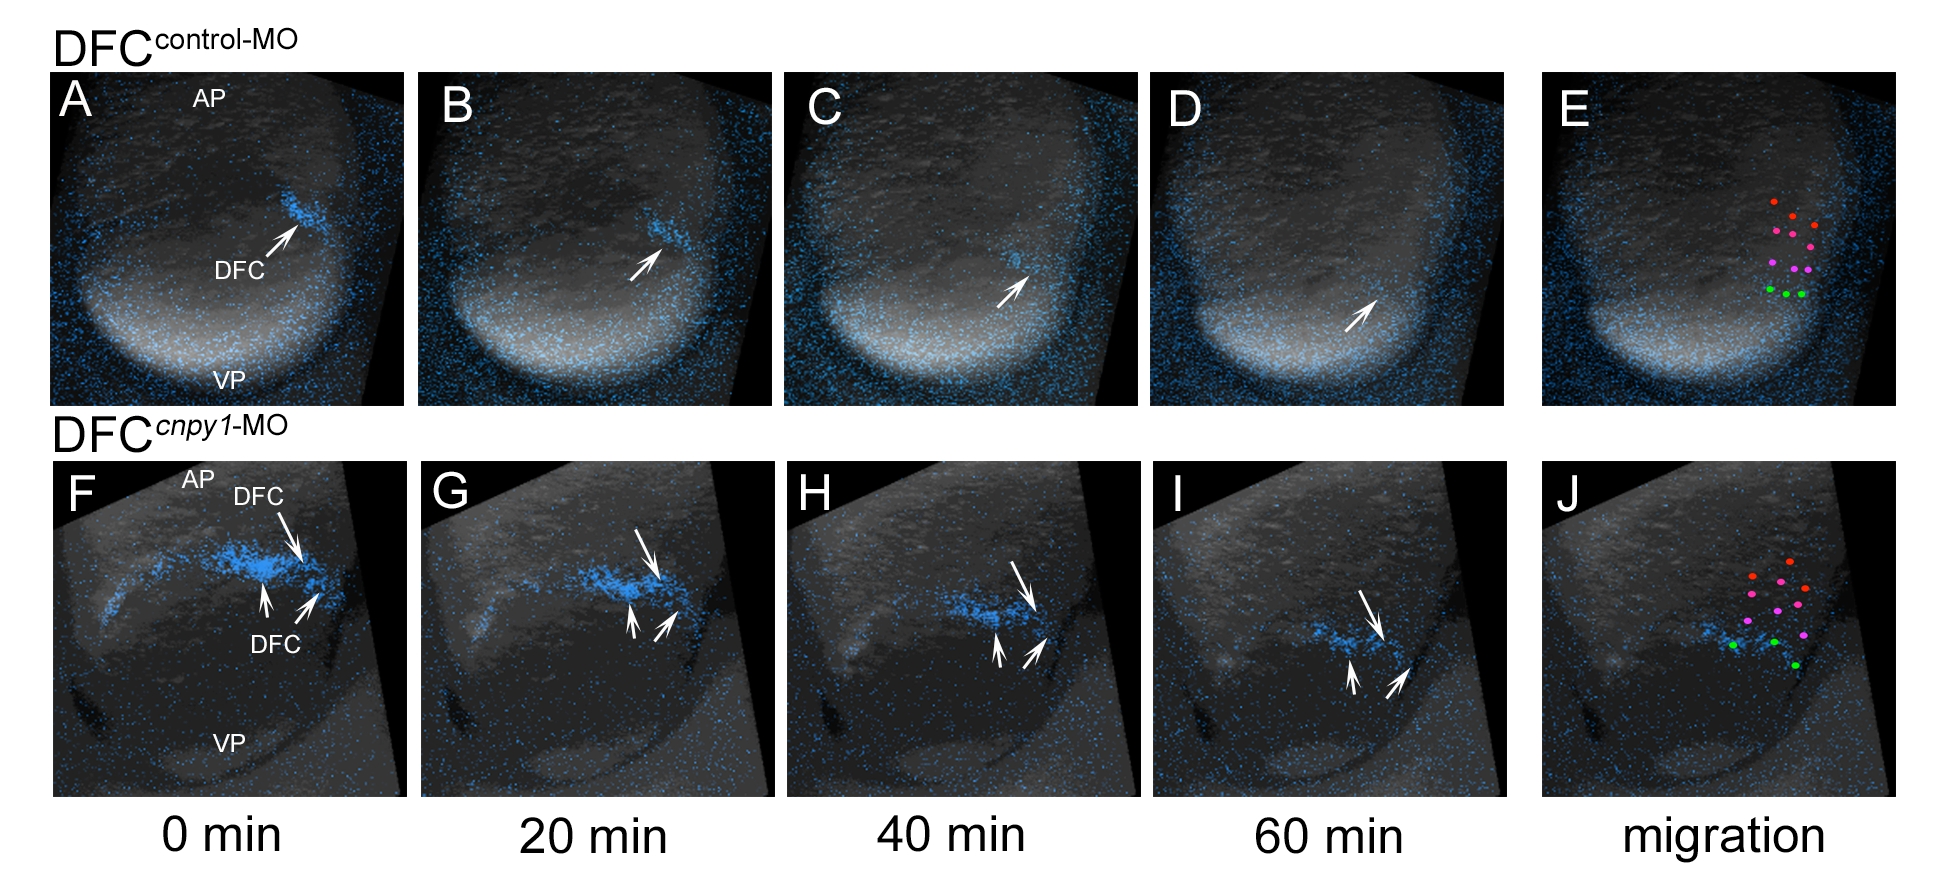
Fig. S4
DFC-specific knockdown of cnpy1 does not affect DFC migration towards the vegetal pole. (A-J) Time-lapse confocal imaging of DFC migration in DFCcontrol-MO-injected (A-E) or DFCcnpy1-MO-injected (F-J) embryos. DFCs were labeled with SYTO17 tracer, and DFC migration was monitored every 2.5 min for 82.5 min. A, F; 0 min, B, G; 20 min, C, H; 40 min, D, I; 60 min. Although a DFC cluster (arrow in A) is found in the DFCcontrol-MO embryo at 0 min, sparse DFC populations (arrows in F) appear in the DFCcnpy1-MO embryo. AP, animal pole; VP, vegetal pole. (E, J) Three cells in each embryo at 0 min are marked by red dots, and their migration is traced at 20-min intervals (indicated by color changes from red [0 min] to green [60 min]).