
|
Fig. 2
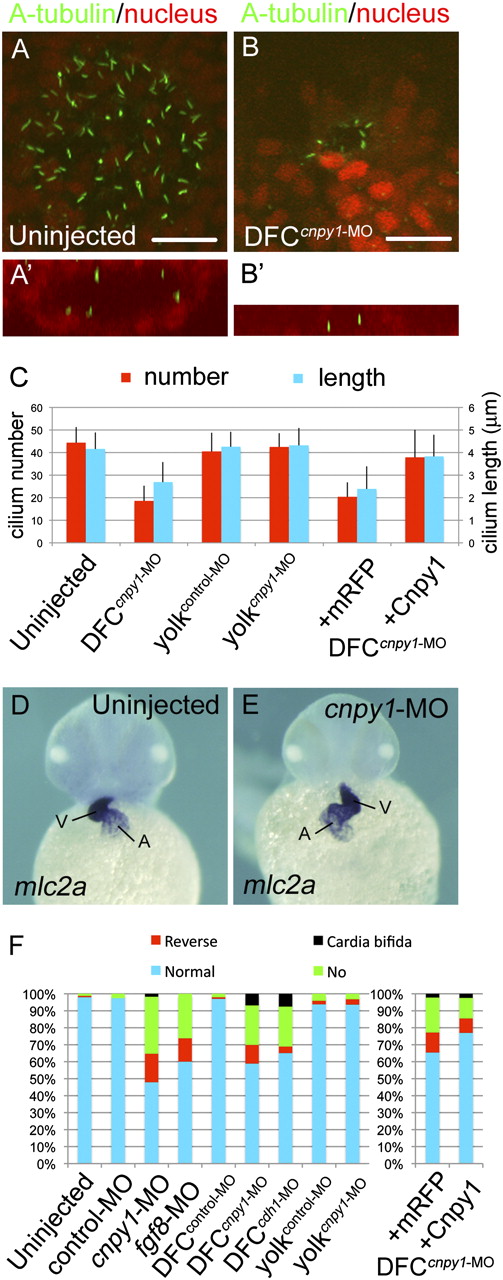
Cnpy1 function within DFCs is essential for ciliogenesis and LR patterning. (A and B) A-tubulin (green) and nucleus (red) staining in uninjected (A) or DFCcnpy1-MO–injected (B) embryos at the six-somite stage. Vegetal pole view. (Scale bars: 20 μm.) (A2 and B2) X–Z view around the KV. Lumen formation was not completed in DFCcnpy1-MO–injected embryos (B2). (C) Number (red) or length (blue) of KV primary cilia in uninjected (n = 10 or 49), DFCcnpy1-MO (n = 10 or 48), yolkcontrol-MO (n = 11 or 77), yolkcnpy1-MO (n = 11 or 58), DFCcnpy1-MO+mRFP (n = 10 or 61), or DFCcnpy1-MO+Cnpy1 (n = 11 or 85) embryos. (Error bars show SEM.) Statistically significant (P < 0.05) differences could be seen in uninjected versus DFCcnpy1-MO and DFCcnpy1-MO+mRFP versus DFCcnpy1-MO+Cnpy1 embryos. (D and E) Representative images of mlc2a expression demonstrating normal looping (uninjected; D) or reversed looping (cnpy1-MO; E) of the heart in embryos at the high pec stage. Ventral view, anterior to the top. A, atrium; V, ventricle. (F) Percentages of normal looping, reversed looping, no looping, or cardia bifida of the heart in uninjected (n = 164), control-MO (n = 118), cnpy1-MO (n = 119), fgf8-MO (n = 65), DFCcontrol-MO (n = 95), DFCcnpy1-MO (n = 146), DFCcdh1-MO (n = 106), yolkcontrol-MO (n = 96), yolkcnpy1-MO (n = 94), DFCcnpy1-MO+mRFP (n = 136), and DFCcnpy1-MO+Cnpy1 (n = 165) embryos. Statistically significant (P < 0.05) differences could be seen in uninjected versus cnpy1-MO, DFCcontrol-MO versus DFCcnpy1-MO, and DFCcnpy1-MO+mRFP versus DFCcnpy1-MO+Cnpy1 embryos.