
|
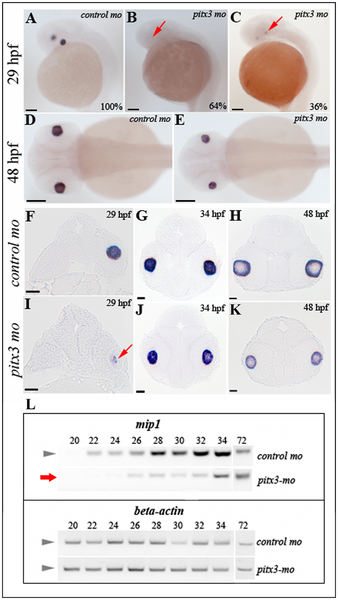
Fig. 7
Analysis of mip1 expression in pitx3-mo and control embryos via in situ hybridization and RT-PCR.
A, D, F-H. Normal mip1 expression in control-injected embryos at 29-, 34- and 48-hpf. B, C, E, I–K. Altered mip1 expression is observed in pitx3 morphants at 29-hpf with 64% of embryos demonstrating a complete absence of mip1 expression (B) and the remaining larvae showing markedly reduced mip1 expression (C and I). Reduced mip1 expression is also observed in 34- and 48-hpf embryos (E, J, K). Red arrows show sites of expected mip1 expression. Scale bars: A–E: 100 μM; F–L: 20 μM. L. Results of semi-quantitative RT-PCR showing reduced expression of mip1 in pitx3 morphants at early stages of development (red arrow).