
Image
|
Figure Caption
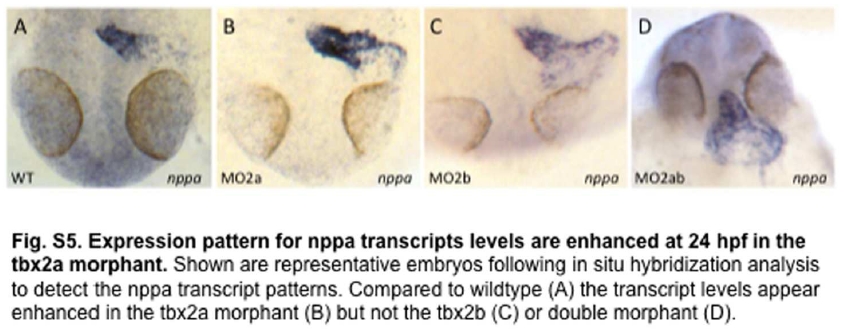
Fig. S5
Expression pattern for mppa transcripts levels are enhanced at 24 hpf in the tbx2a morphant. Shown are representative embryos following in situ hybridization analysis to detect the nppa transcript patterns. Compared to wildtype (A) the transcript levels appear enhanced in the tbx2a morphant (B) but not the tbx2b (C) or double morphant (D).
Acknowledgments
This image is the copyrighted work of the attributed author or publisher, and
ZFIN has permission only to display this image to its users.
Additional permissions should be obtained from the applicable author or publisher of the image.
Full text @ Dev. Dyn.