
Fig. 8
|
Fig. 8
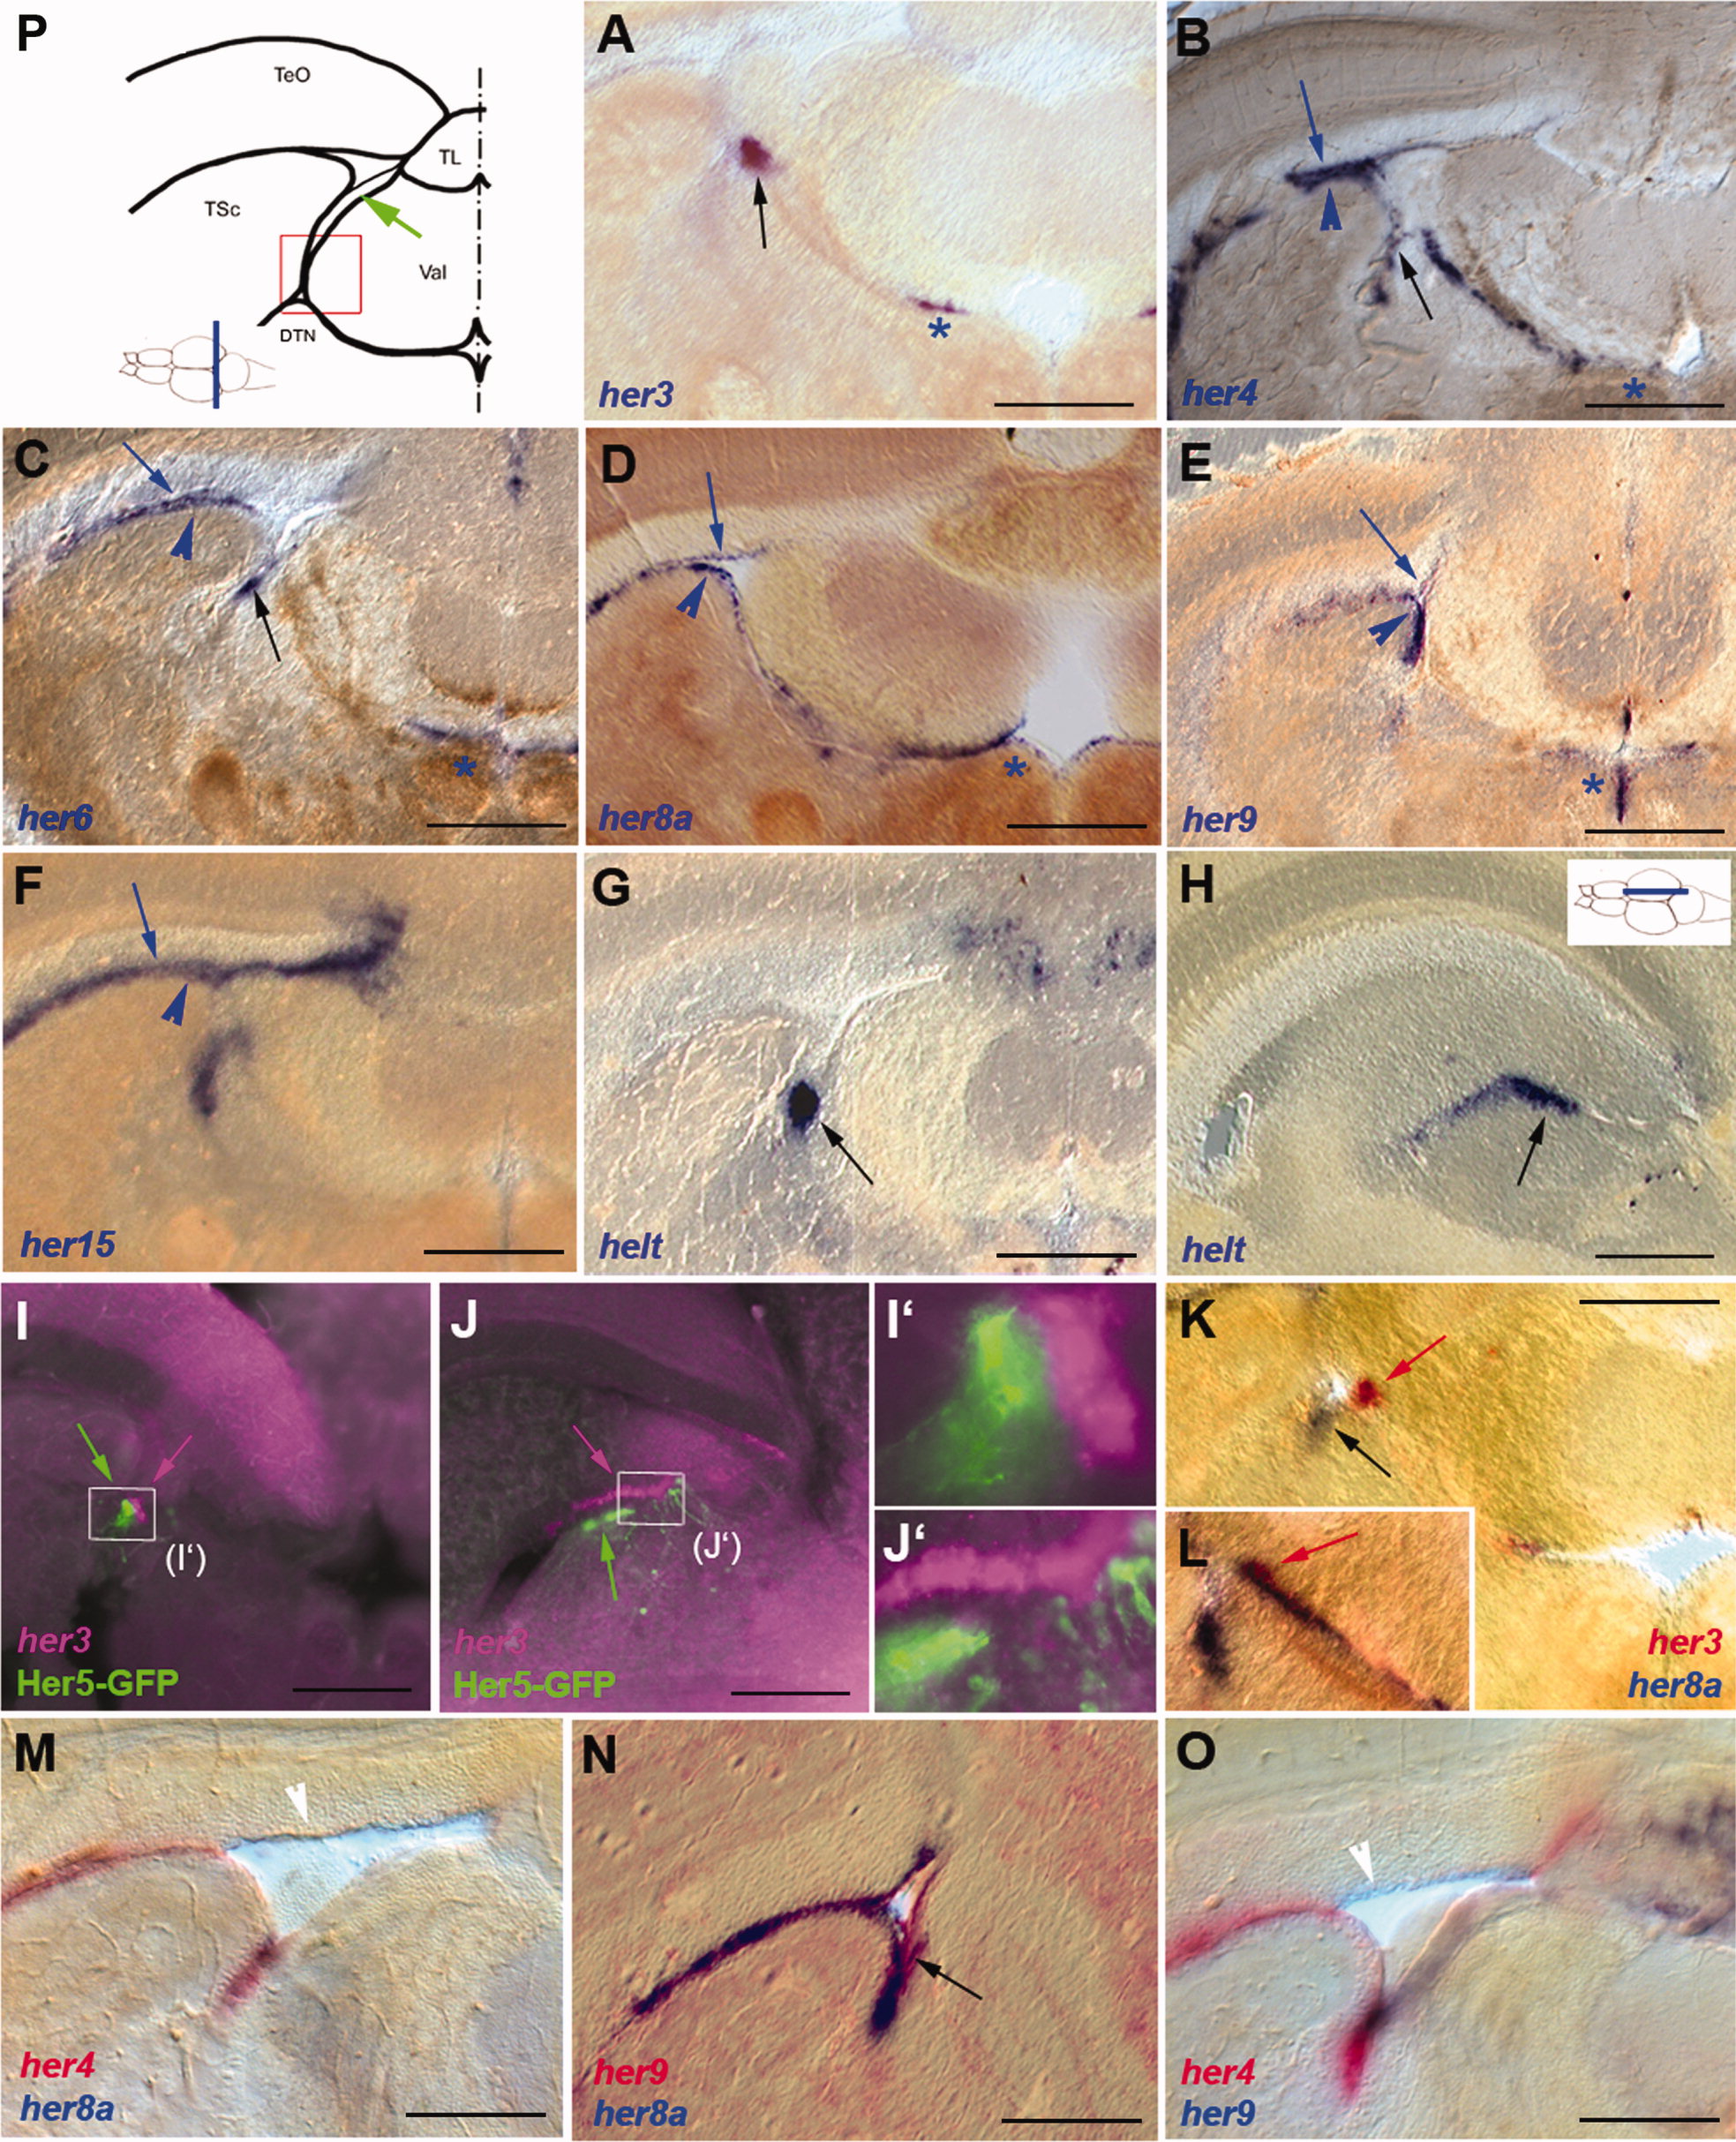
Expression of her genes in the adult posterior midbrain. Expression was detected by in situ hybridization (blue and red stainings) or immunocytochemistry (GFP expression in the Tg(her5:egfp) line, green staining) on 80-μm vibratome cross-sections as depicted, except for H (sagittal section, level indicated). A–H: Expression of single genes. The thin blue arrowheads point to the tectal periventricular gray zone, the thick blue arrowheads to expression along the VZ of the torus semicircularis, and the black arrows to expression in the IPZ, when visible. Note the restricted expression of her3 and helt and that expression of all genes (except for her5 and helt) is also visible in medial locations along the tectal ventricle (stars). I–L: Comparison of the expression of her3 (I–J2: magenta, K,L: red), Her5-GFP (green), and her8a (blue) demonstrates the immediately adjacent locations of positive cell groups. M–O: Comparison of the expression of her4, her8a, and her9 highlights the virtually identical profiles of these genes. The white arrowheads point to fading expression in areas where the tectal ventricle is large, and the black arrow points to the IPZ. P: Schematic representation of the section levels illustrated in A–G,I–O. The red box delimits the area magnified in I2,J2, and the green arrow points to the isthmic proliferation zone (IPZ). DTN, dorsal tegmental nucleus; TeO, optic tectum; TL, torus longitudinalis; TSc, torus semicircularis; Val, valvula cerebelli. Scale bars = 200 μm in A–G,K; 150 μm in H–J2 100 μm in M–O.