
Fig. 5
|
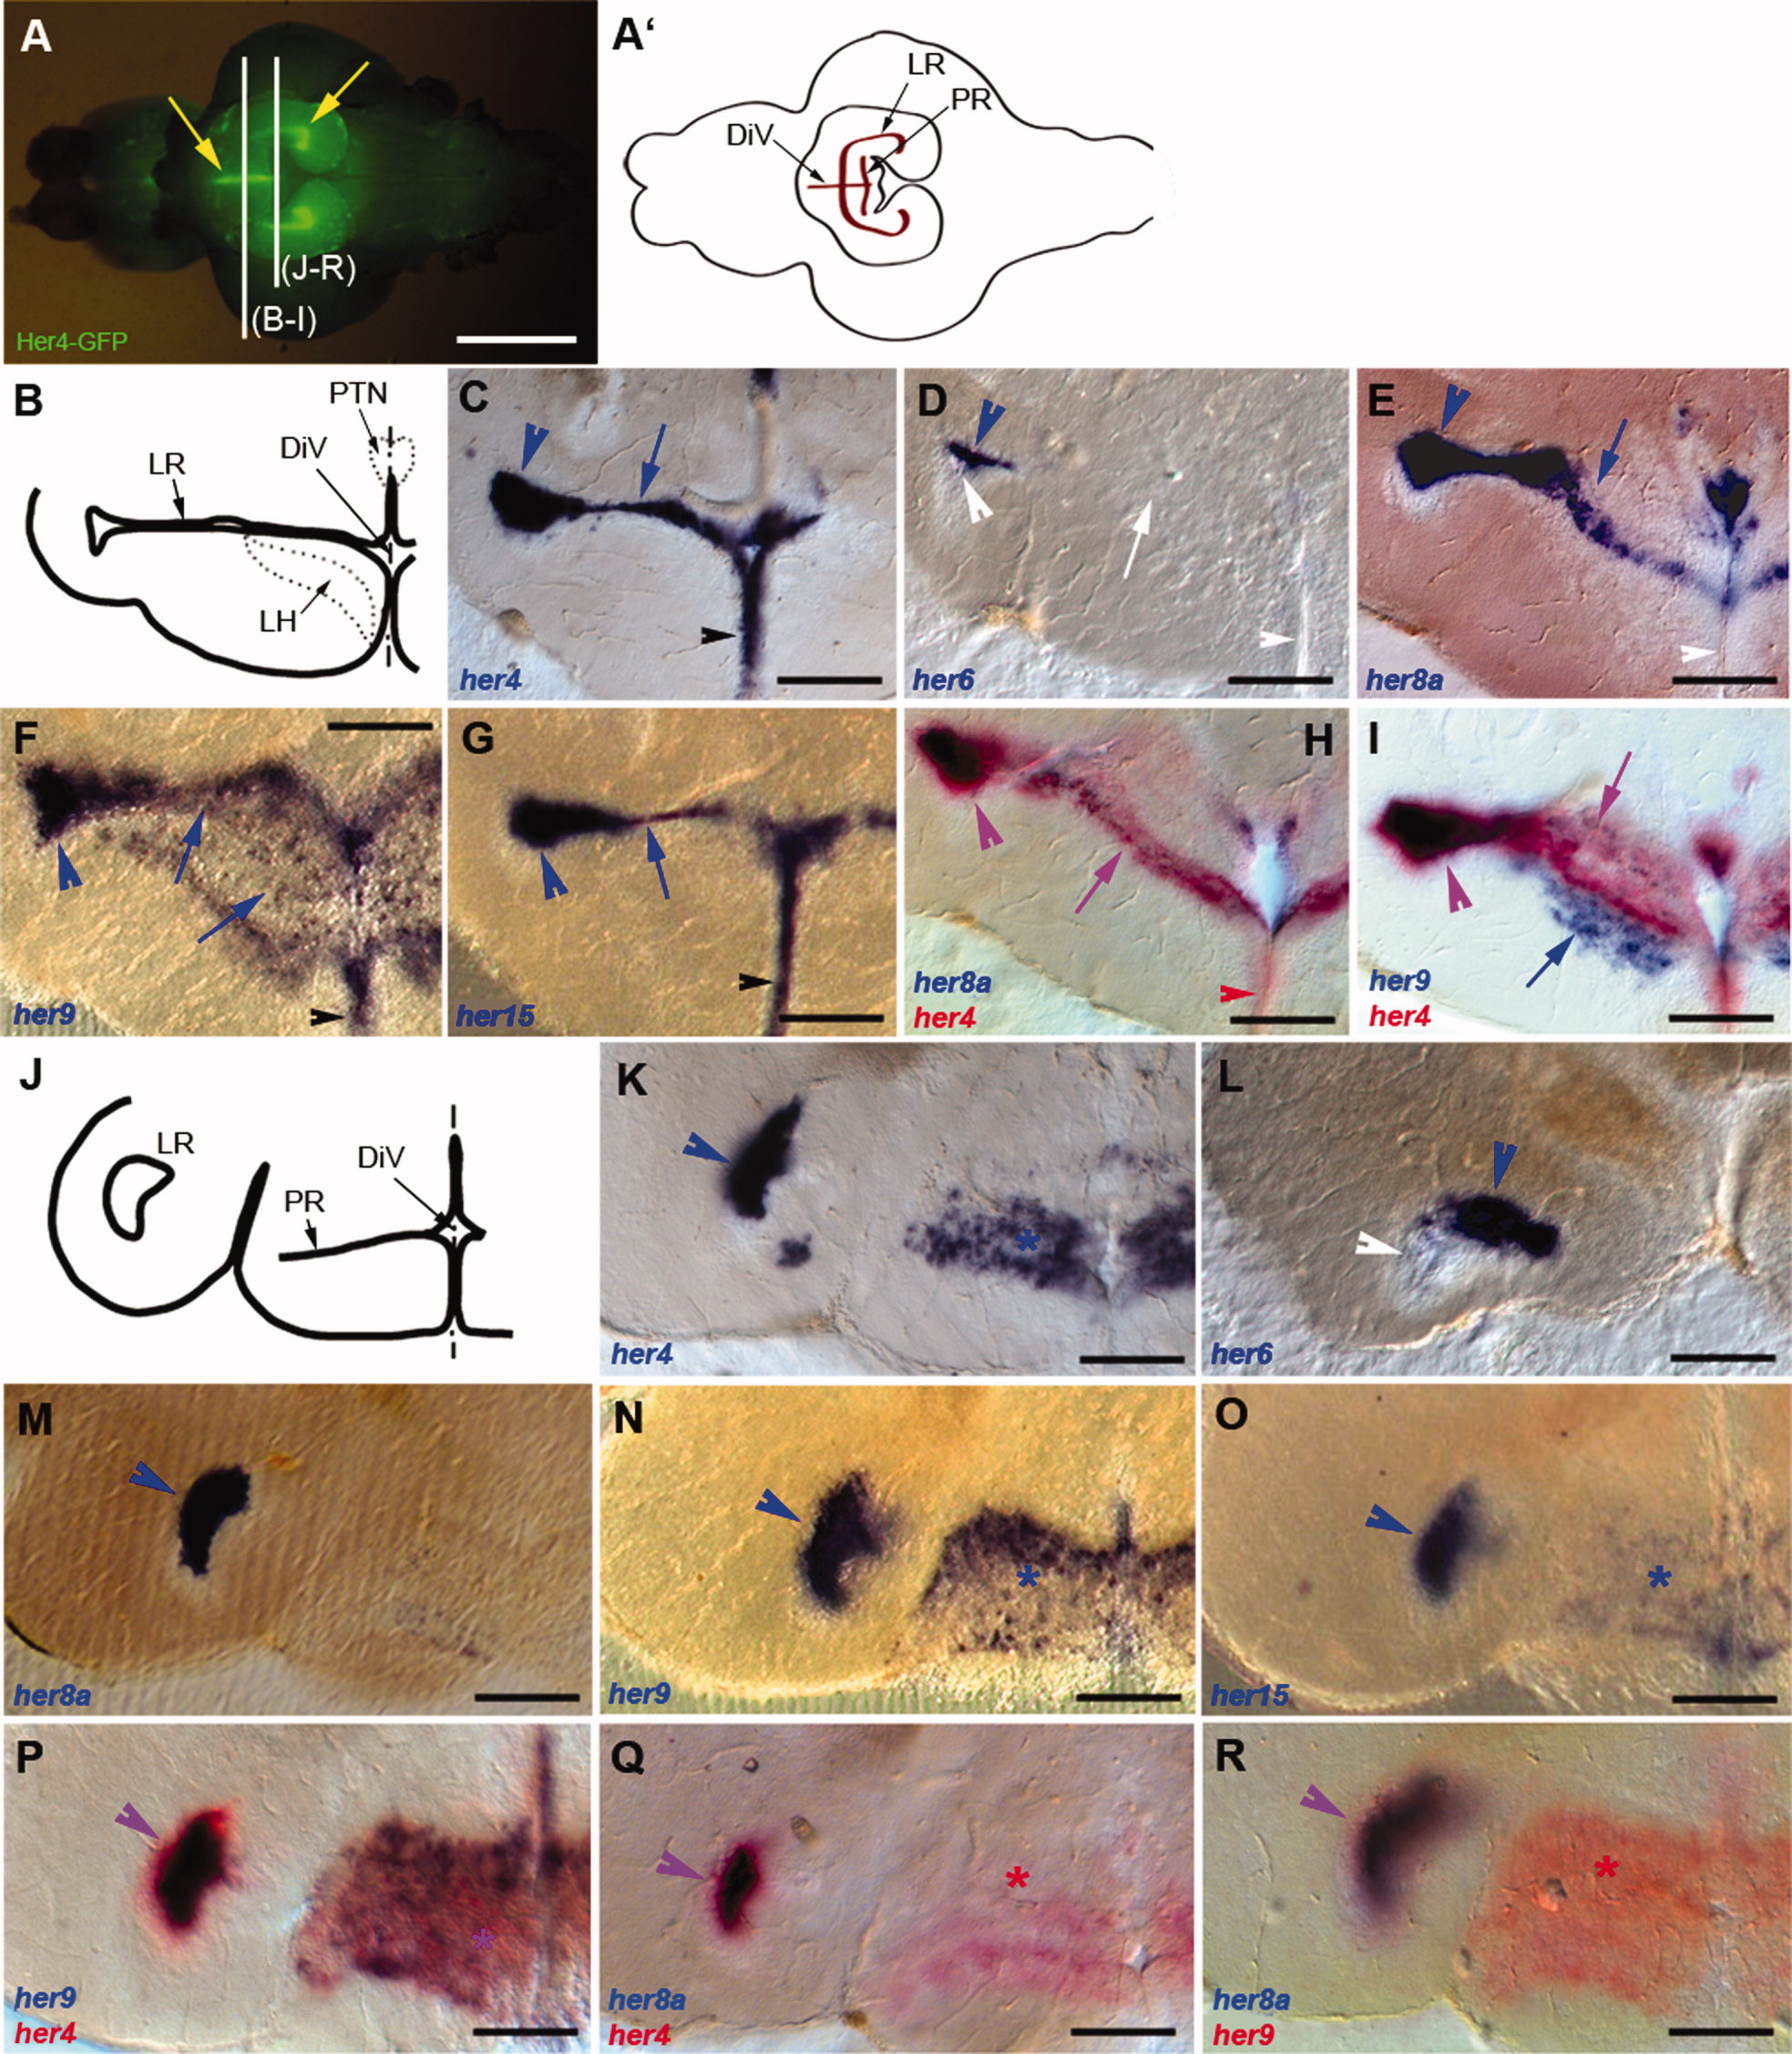
Fig. 5
Expression of her genes in the hypothalamus. Expression was detected using in situ hybridization (blue and red stainings) on 80-μm vibratome cross-sections at anterior (B–I) or more posterior (J–R) levels, as indicated in A. A: Ventral view of the dissected brain of a Tg(her4:egfp) animal (Yeo et al.,2007; anterior left) observed under fluorescence stereomicroscopy and highlighting the shape of the hypothalamic ventricles (yellow arrows). A2: Schematized view of A with the extensions of the diencephalic ventricle in the hypothalamus highlighted in brown. B,J: Schematic representations of the sections at the levels illustrated in C–I and K–R, respectively. C–I,K–R: Compared expression of her4, -6, -8a, -9, and -15 in single and double ISH (color-coded). In C–I, large arrowheads and arrows point to the LR and small arrowheads to the medialmost aspect of the DiV. In K–R, large arrowheads point to the LR, and asterisks indicate the PR. White labels point to an absence of staining, and purple labels to costaining in double ISH panels. Note the strong coexpression of all genes in the lateralmost extension of the LR (arrowheads), whereas the more medial part of the LR extension is conspicuous for its absence of her6 expression at all anteroposterior levels (D,L). Note also the lack of her8a expression in the PR (M,Q). Finally, her9 also labels the LH (I, blue arrow). DiV, diencephalic ventricle; LH, lateral hypothalamic nucleus; LR, lateral recess; PR, posterior recess; PTN, posterior tuberal nucleus. Scale bars = 1 mm in A; 100 μm in B–R.