
Fig. 2
|
Fig. 2
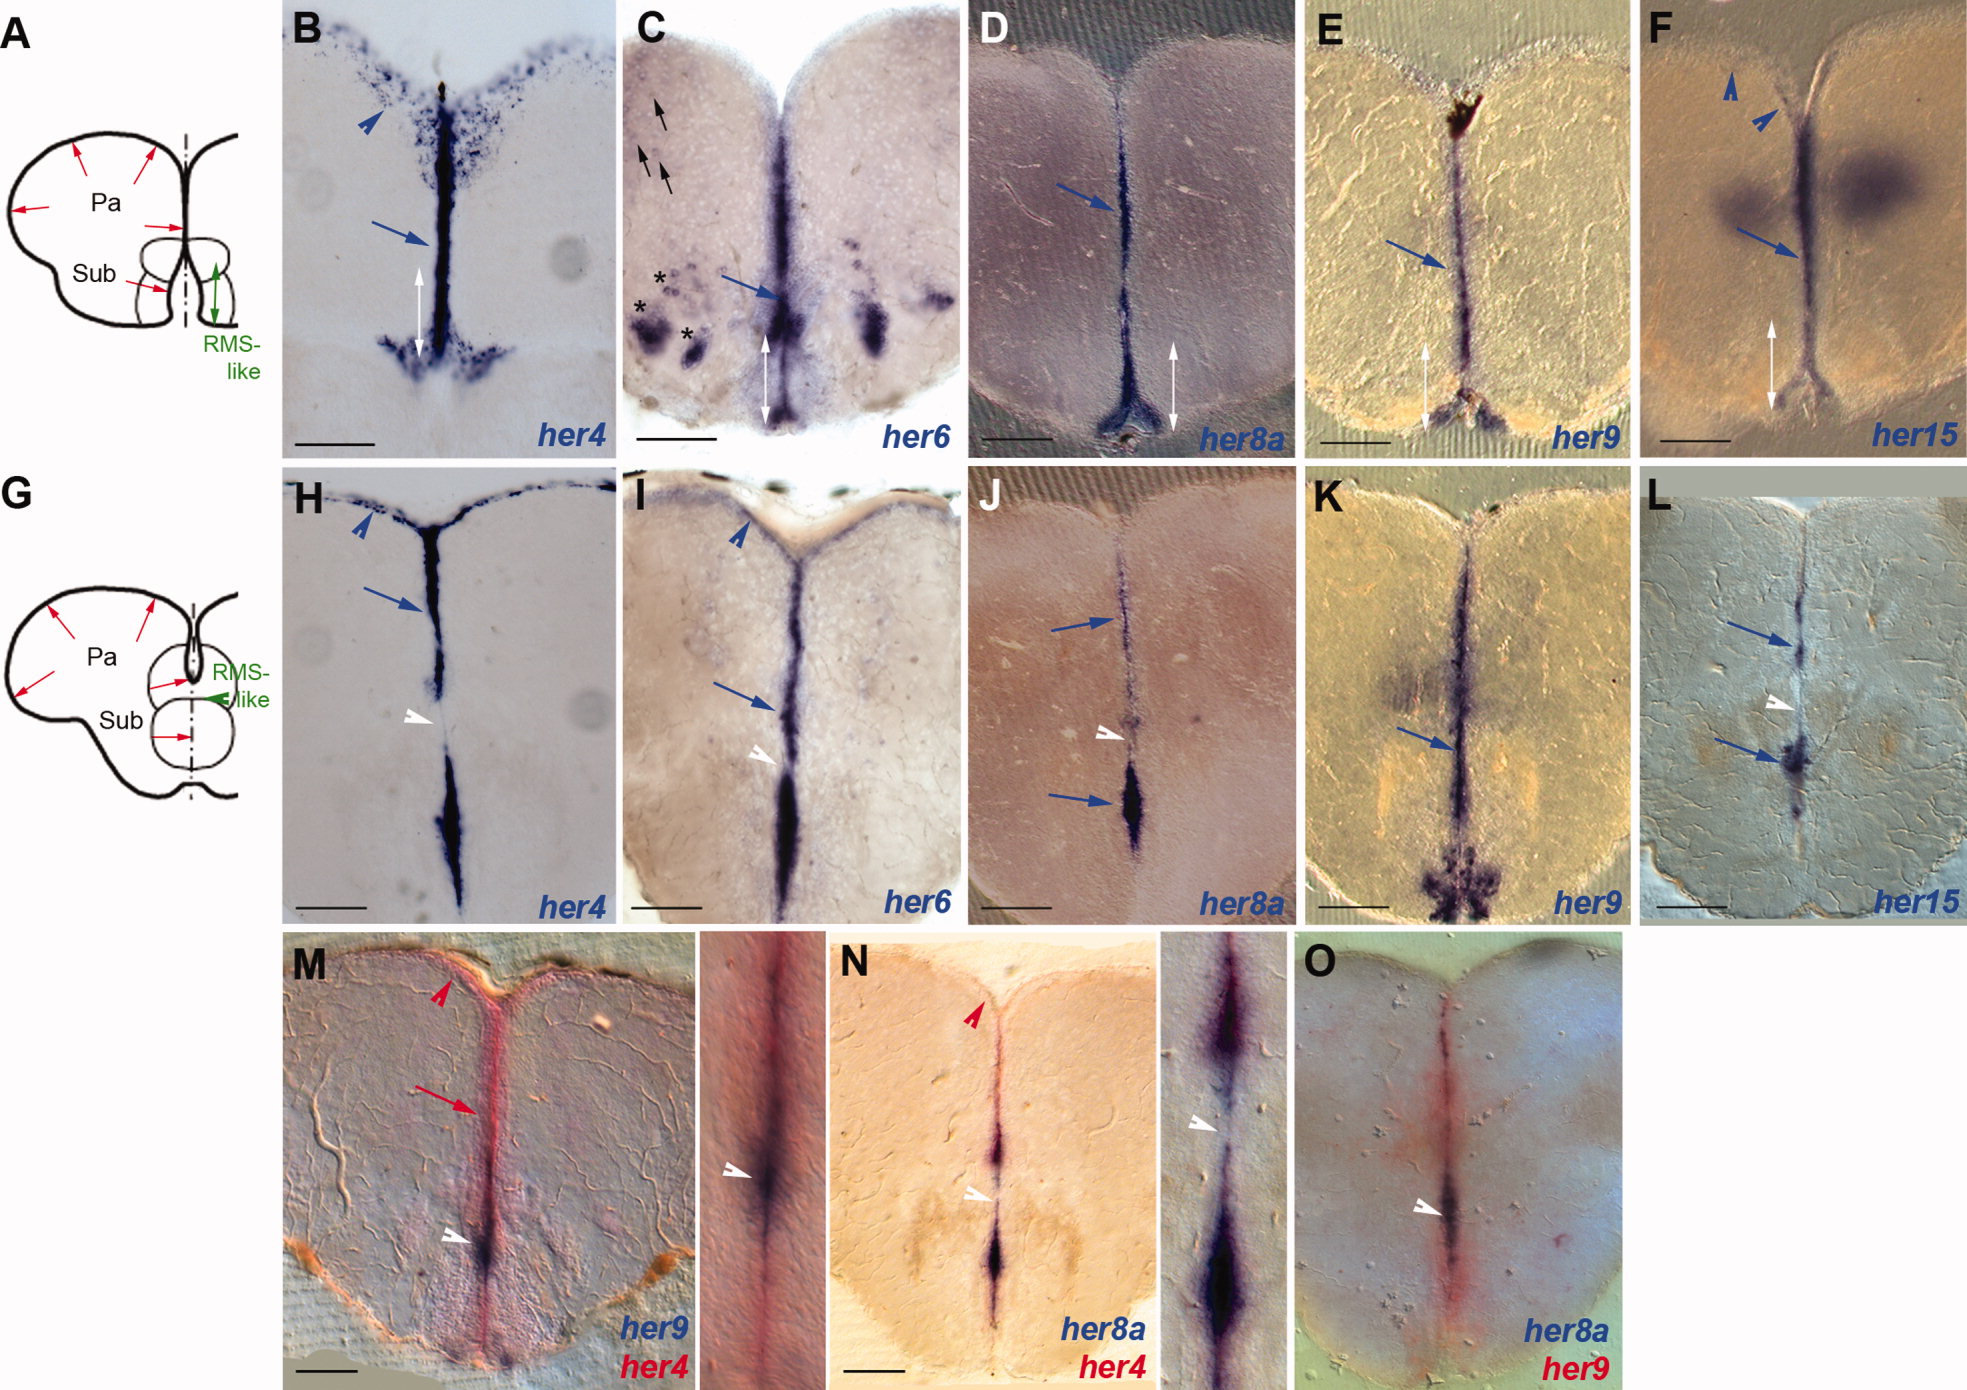
Expression of her genes in the adult telencephalon. Expression was detected by in situ hybridization (blue and red stainings, color-coded) on 80-μm vibratome cross-sections at anterior (A–F) or more posterior (G–O) levels, both located rostral to the preoptic area. A,G: Schematic representation of the sections at the levels illustrated; red arrows indicate the ventricular zone (VZ), and the green double arrow and green arrowhead point to the RMS-like stripe. B–F,H–O: her4, -6, -8a, -9, and -15 are largely coexpressed at the VZ (blue arrows), although her6 transcripts are found only weakly in the anterior aspect of the RMS-like stripe (indicated by white double arrows). Some her6-expressing cells can also be detected in the parenchyma of the subpallium (asterisks) and pallium (black arrows); the latter showed quite variable expression levels between samples. her4 Expression is strongest and clearly visible also in the dorsal pallium (blue arrowheads). On posterior sections (level G), note that her9 expression is not interrupted across the RMS-like stripe (see also white arrowheads in M–O). We did not detect expression of her5 or helt in the telencephalon using in situ hybridization. Pa, pallium; Sub, subpallium. Scale bars = 100 μm.