
|
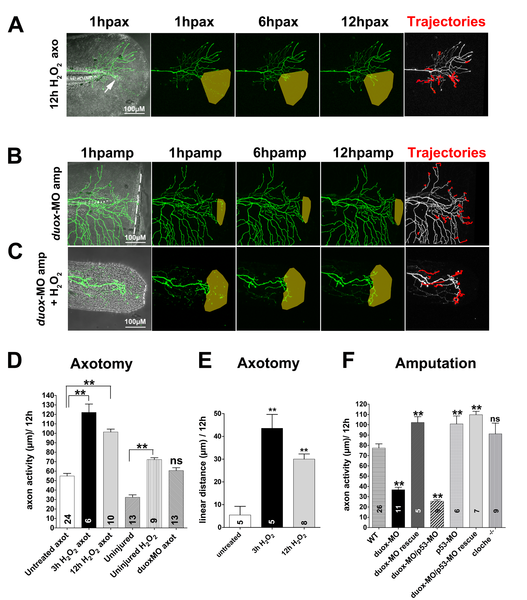
Fig. 6
Time-lapse sequences from 78–90 hpf. The rightmost panel shows axon tip trajectories (red) over the course of the time-lapse; denervated territories are indicated by shaded areas. (A) Adding 3 mM H2O2 to the larval media for 12 h enhanced axon growth and promoted reinnervation of denervated territory after axotomy (arrow) in a non-amputated fin (see also Video S6). (B) Fin amputation did not promote axon growth in a duox1-morphant larva. The axon trajectories reflect mostly tissue movement during the time-lapse (see Video S7). (C) Adding 1.5 mM H2O2 rescued axon growth and improved reinnervation of denervated territory in amputated duox1-morphants (see also Video S8). (D, E) Quantification of axon activity (D) and linear axon growth (E) after axotomy in larvae treated with H2O2. (F) Quantification of axon activity after fin amputation. Sample size for each group is indicated by the number in the bar. Error bars represent the standard error of the mean. For statistical analyses, we performed one-way ANOVA and either Dunnett′s post-test to compare individual groups to controls (asterisks above bar indicate significance compared to control, the first column in each graph) or Bonferroni′s post-test to compare individual groups with each other (as indicated by brackets, p = ns>0.05, ** p<0.01). axo, axotomy; amp, amputation.