
|
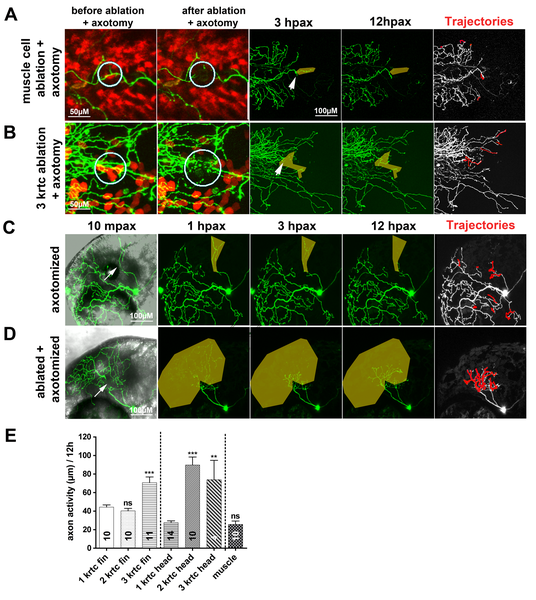
Fig. 4
Time-lapse sequences from 78–90 hpf. The rightmost panel shows axon tip trajectories (red) over the course of the time-lapse. (A) Ablating muscle cells (circles) in the fin of a transgenic reporter larva was accompanied by only limited regeneration of an axotomized arbor (arrow). (B) Ablating e3 keratinocytes (red) (circles) in the fin promoted axon regeneration after axotomy (arrow) and improved reinnervation of denervated territory (shaded area). (C) Axotomy of a trigeminal axon branch in the head (arrow) induced limited growth of the severed axon, but the denervated territory was avoided (shaded area). (D) Ablation of e3 keratinocytes and axotomy of a trigeminal axon (arrow) promoted robust growth of the severed axon and reinnervation of the denervated territory (shaded area). (E) Quantification of axon activity after keratinocyte and muscle cell ablations. Sample size for each group is indicated by the number in the bar. Error bars represent the standard error of the mean. For statistical analyses, we performed one-way ANOVA and Dunnett′s post-test to compare individual groups to control groups (ablation of 1 keratinocyte in the fin or the head) (asterisks above bars indicate significance compared to control) (p = ns>0.05, ** p<0.01, *** p<0.001). krtc, keratinocyte.