
|
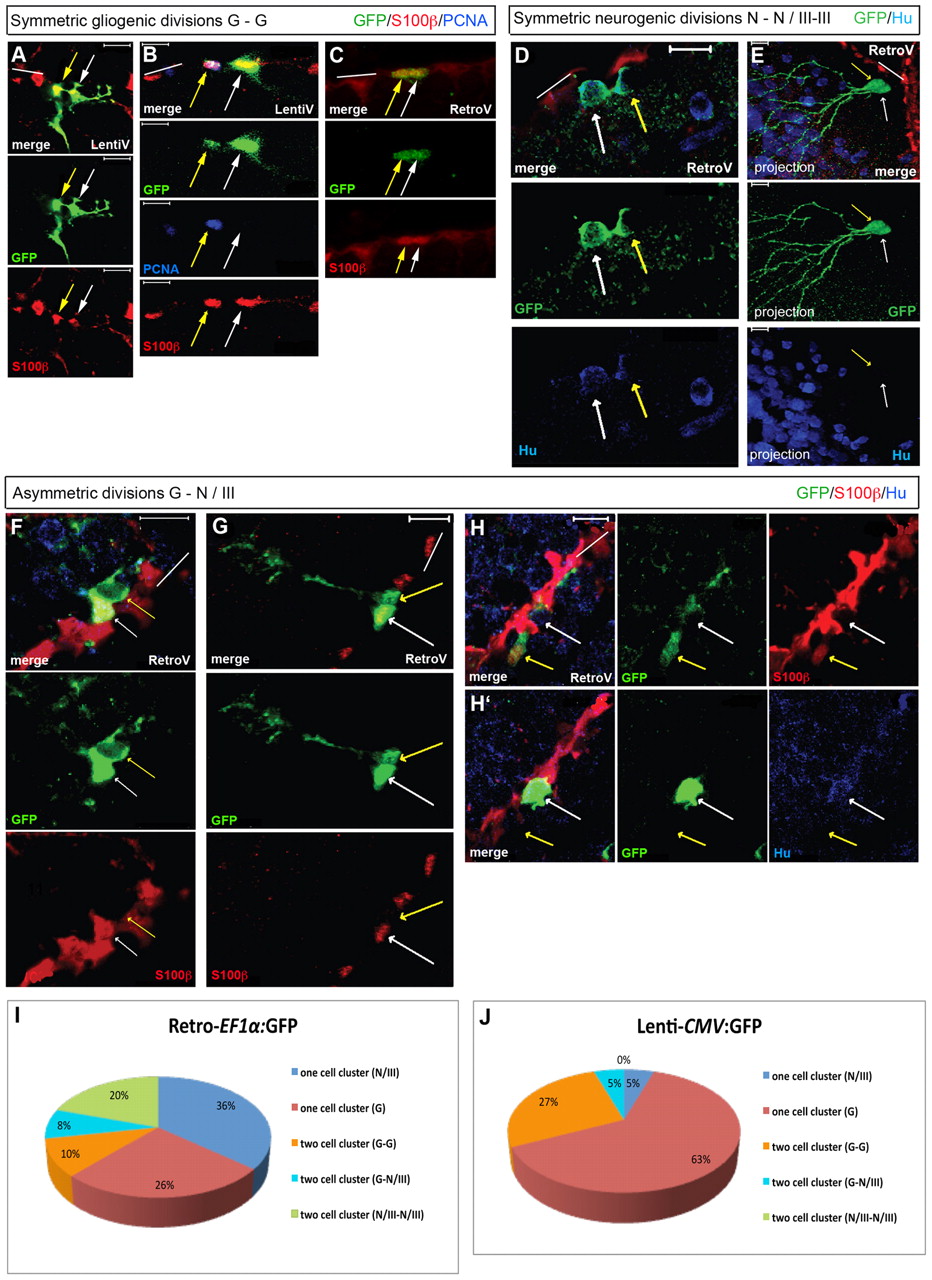
Fig. 5
Analysis of cell divisions at the single cell level. All brains were analyzed at 21-28 dpi. Brain sections were immunostained with GFP, S100β (red), HuC/D or PCNA. We considered S100β-negative cells to be fated towards a neuronal identity in cases where only a double labeling for S100β and GFP was used (cells referred to as ‘III’, indicating a neuroblast identity). S100β-positive cells are identified as glia (‘G’) and HuC/D-positive cells as neurons (‘N’) (single confocal planes of merged fluorescence and single fluorescence pictures, ventricular zone indicated by white bars). In E, a projection of several confocal stacks is illustrated; the two daughter cells are indicated by white and yellow arrows. (A-C) Gliogenic divisions (‘G-G’) observed after lentiviral (A,B) or retroviral (C) transduction. In B, the section is stained for PCNA, illustrating self-renewal. (D,E) Symmetric neurogenic divisions traced using a retrovirus. In both cases, the GFP-positive daughters are located away from the VZ (red). In E, these cells do not express detectable HuC/D levels, but harbor a developed dendritic tree. (F-H2) Asymmetric divisions generating a radial glia and a S100β-negative neuroblast (F,G) or neuron (H) (H and H2 are two adjacent focal planes of the same section). (I,J) Quantification of the one- and two-cell clones observed after 21-28 dpi for each viral type (retrovirus: 50 cell clones in four brains, lentivirus: 22 cell clones in four brains). Scale bars: 10 μm.