
|
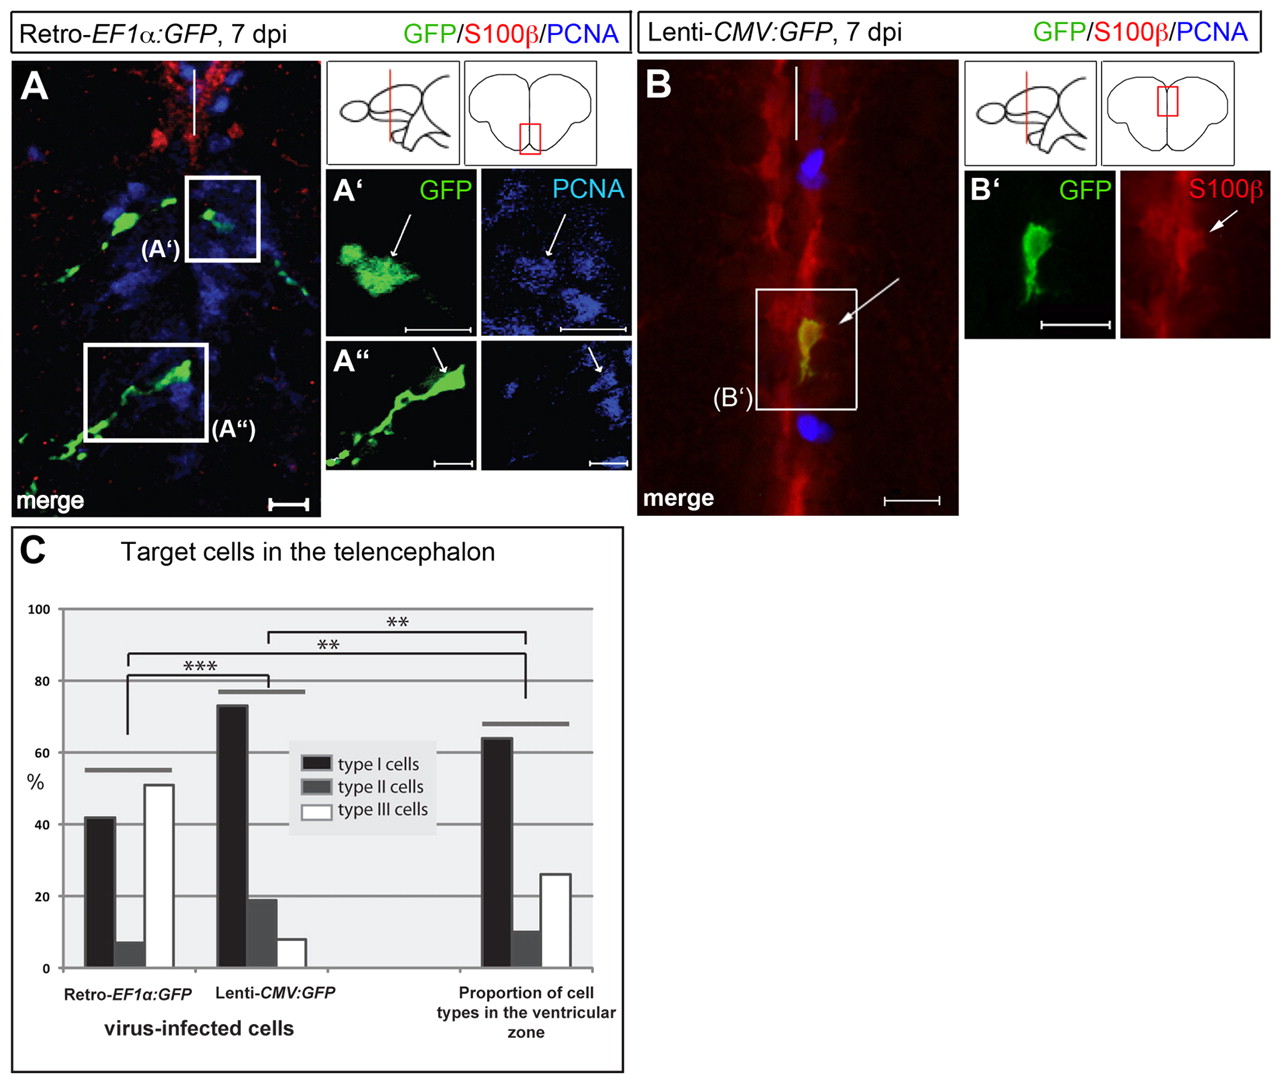
Fig. 1
Retro- and lentiviruses differently target the telencephalic ventricular cell types. (A,B) Typical examples of the main cell type targeted by Retro-EF1α:GFP (A) and Lenti-CMV:GFP (B) infections at 7 dpi. Immunostaining for GFP (green), radial glia (S100β, red) and the proliferation marker PCNA (blue) is shown in the telencephalon (80 μm coronal sections; single optical planes observed by confocal microscopy; dorsal upwards; section plane and position of the micrographs shown on the cartoons; ventricle indicated by white bars). (A2,A3,B2) Higher magnifications of the single channels. Scale bars: 10 μm. Arrows indicate the transduced cells of interest. (C) Quantification at 7 dpi of the proportion of cell types I, II and III transduced with the two viruses (left bars, counted across the whole telencephalic VZ). Retroviral infection: 42% type I, 7% type II, 51% type III cells (60 cells from four brains). Lentiviral infection: 73% type I, 19% type II, 8% type III cells (26 cells from four brains). The right panel shows the normal distribution of the three cell types in the telencephalic VZ (type I, 64%; type II, 10%; type III, 26%) (3006 cells counted). Fisher′s test: **P=0.001314 and P=0.001330 (comparison of the proportion of retrovirus-transduced cells and lentivirus-transduced cells, respectively, with the uninfected situation); ***P=0.0001295.