
Image
|
Figure Caption
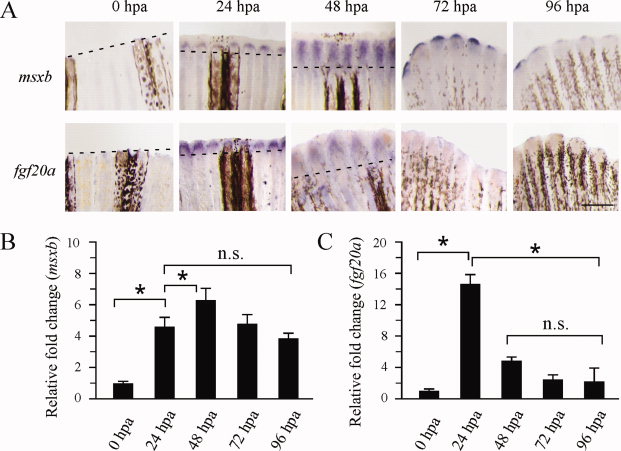
Fig. 1
Expression of msxb and fgf20a during fin regeneration in adult zebrafish (between 6 and 8 months old). A: In situ hybridization of msxb and fgf20a at 0, 24, 48, 72, and 96 hpa, respectively. Dashed lines indicate the plane of amputation. Scale bar = 1 mm. B, C: Real-time RT-PCR analysis of the expression of msxb and fgf20a at different times during regeneration. The expression levels of msxb and fgf20a at 0 hpa (control) were normalized to 1, respectively. Data represents the means ± SE. n = 4 for each measurement. n.s., not significant; *P < 0.05.
Acknowledgments
This image is the copyrighted work of the attributed author or publisher, and
ZFIN has permission only to display this image to its users.
Additional permissions should be obtained from the applicable author or publisher of the image.
Full text @ Dev. Dyn.