
|
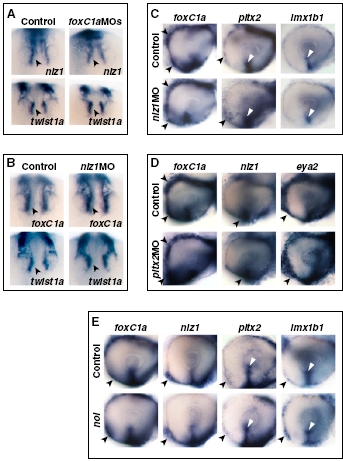
Fig. s11
Expression patterns of POM genes in POM gene morphants. (A) Frontal/dorsal views of 20s hybridized embryos showing no differences in the expression of nlz1 and twist1a in migrating POM (arrowheads) between the controls and the foxC1a MO-injected embryos. (B) Frontal/dorsal views of 22s hybridized embryos showing no differences in the expression of foxC1a and twist1a in migrating POM (arrowheads) between the controls and the nlz1 MO-injected embryos. (C and D) Lateral views of eyes from 31- to 32-hpf hybridized controls or embryos injected with the indicated MOs. (C) foxC1a, pitx2, and lmx1b1 expression in anterior POM (arrowheads) and/or within the choroid fissure (white triangles) is not affected in the nlz1 MO-injected embryos. (D) Expression of foxC1a, nlz1, and eya2 in anterior POM (arrowheads) is not affected in the pitx2 MO-injected embryos. (E) Lateral views of eyes from 32-hpf hybridized controls or noi embryos showing no appreciable differences in the expression of foxC1a, nlz1, pitx2, and lmx1b1 in anterior POM (arrowheads) and/ or within the choroid fissure (white triangles).