
|
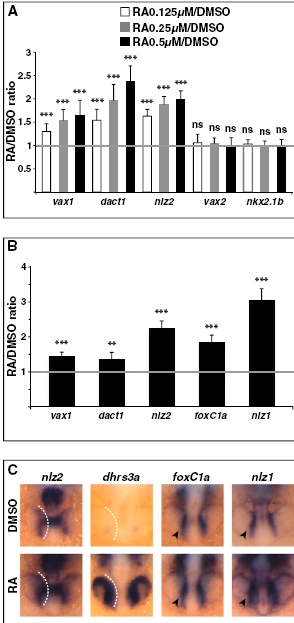
Fig. s9
Early response genes to up-regulated RA signaling. (A) Real-time PCR quantification of gene expression in 25- to 26-hpf whole embryos after embryo treatments with the indicated reagents from 3s, shown as the mean ratio between RA and DMSO conditions in 10 biological replicates. Error bars show SDs. ***P < 0.001; ns, nonsignificant (P e 0.05) according to two-tailed Student’s t test. (B and C) Embryos at 18s were incubated in DMSO or 0.5 μM RA for 30– 50 min and harvested for gene expression analysis by real-time PCR (B) or ISH (C). (B) Results of real-time PCR quantification shown as the ratio between RA and DMSO conditions and representing the mean of eight biological replicates for vax1, dact1, and foxC1a or six biological replicates for nlz2 and nlz1. Error bars show SDs. **P < 0.01; ***P < 0.001 according to two-tailed Student’s t test. (C) Dorsal/anterior views of heads of 18s whole embryos hybridized with the indicated probes. RA treatment enhances expression of nlz2 and dhrs3a in the optic vesicle and of foxC1a and nlz1 in migrating POM cells (arrowheads). White dashed lines highlight the proximal edge of the optic vesicle.