
Fig. 2
- ID
- ZDB-IMAGE-110622-100
- Genes
- Publication
- Nevin et al., 2011 - Topoisomerase II{beta} is required for lamina-specific targeting of retinal ganglion cell axons and dendrites
- All Figures
- Figures for Nevin et al., 2011
|
Fig. 2
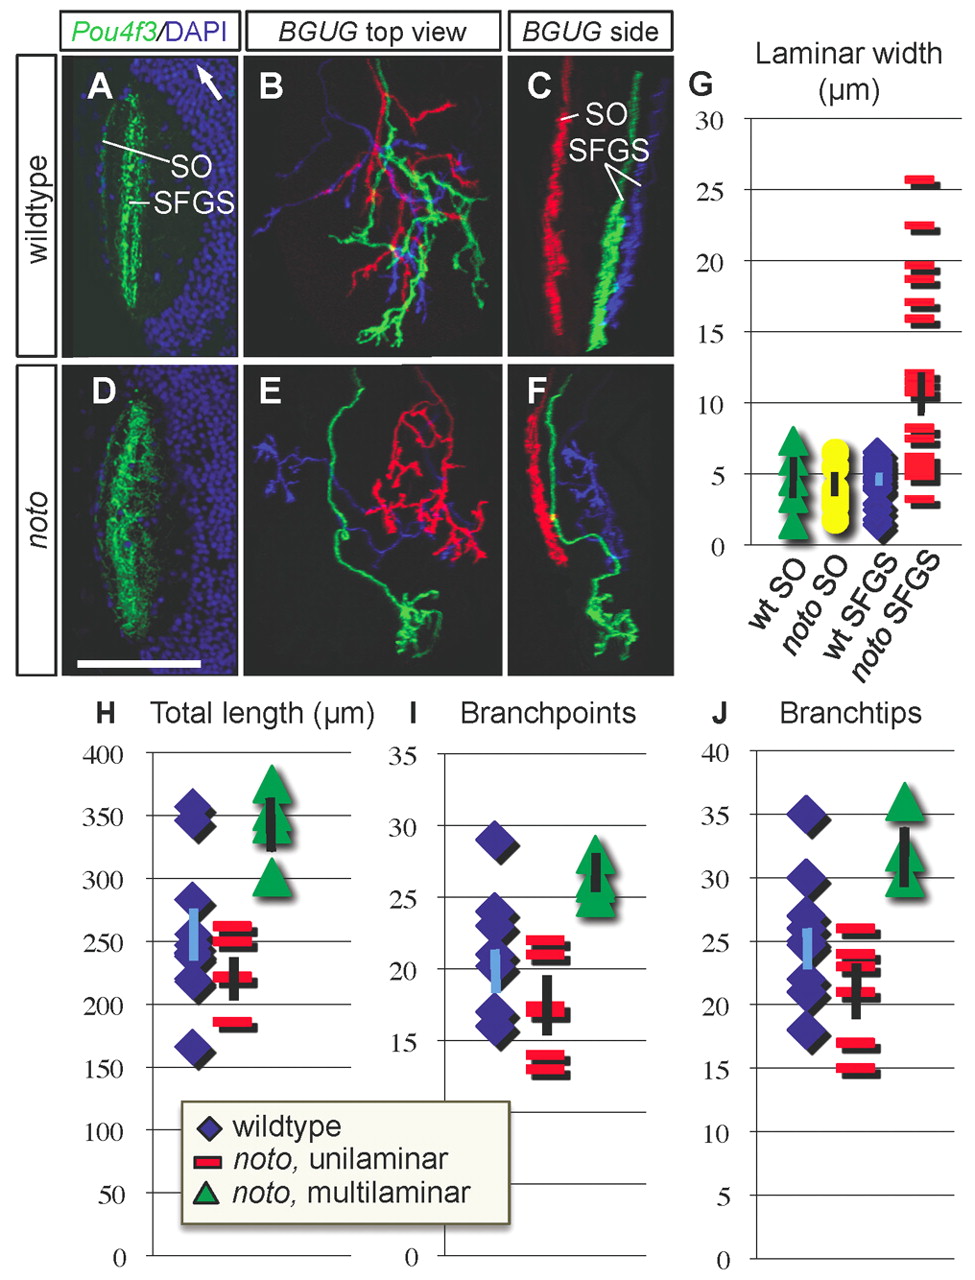
noto mutant ganglion cell (GC) axons project aberrantly between SFGS tectal sublaminae. (A,D) Representative horizontal sections of wild-type (A) and mutant (D) tectum in Pou4f3:mGFP+ 5 dpf zebrafish larvae. GFP is in green, DAPI nuclear stain is in blue. White arrow in A points rostrally. (B,C,E,F) Small numbers of GC axons labeled in BGUG+ transgenic wild-type (B,C) and mutant (E,F) larvae. Images are projections of confocal stacks in top (B,E) and side (C,F) views. Each red axon lies in SO; blue and green axons innervate SFGS. Both green and blue axons in panel F are wider than 10 µm in side view and scored as multilaminar. Scale bar: 70 μm for A,D; 50 μm for B,C,E,F. (G) Scatter graph of side-view widths of wild-type SO (n=4), mutant SO (n=6), wild-type SFGS (n=24) and mutant SFGS (n=24) axons in wild type and mutant. (H-J) Morphometric analysis of wild-type and mutant BGUG+ GC axons. Scatter plots showing total arbor length (H), number of branchpoints (I) and number of branchtips (J) in wild-type (n=10), mutant unilaminar (n=5) and mutant multilaminar (n=3) SFGS axons. Population means are plotted as points, error bars represent s.e.m.