
|
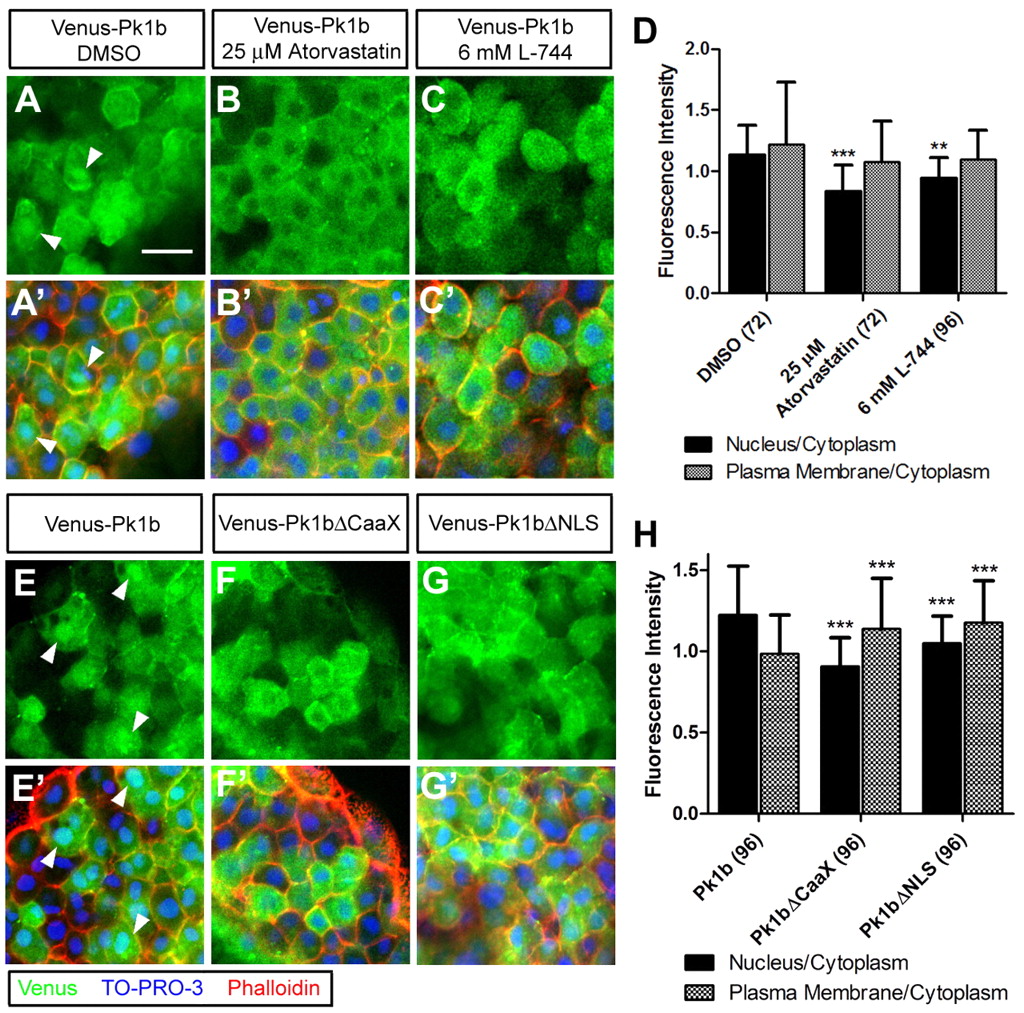
Fig. 3 Nuclear localization of Venus-Pk1b is mediated by farnesylation and NLS motifs. (A-C′) Single confocal sections of zebrafish blastulae expressing Venus-Pk1b (green) treated with DMSO (A,A′, control), atorvastatin (B,B2) or L-744 (C,C′), with nuclei labeled by TO-PRO-3 (A′-C′, blue) and plasma membrane labeled by Rhodamine phalloidin (A′-C′, red). Arrowheads highlight cells with elevated nuclear localization. (D) Ratio of fluorescence intensity in nuclei versus cytoplasm (black bars) and plasma membrane versus cytoplasm (gray bars) for the treatments indicated. The number of cells scored is indicated in parentheses. (E-G′) Blastulae expressing Venus-Pk1b (E), Venus-Pk1bΔCaaX (F) or Venus-Pk1bΔNLS (G) (green), with nuclei (E′-G′, blue) and plasma membrane (E2-G2, red) labeled. Arrowheads highlight cells with elevated nuclear localization. (H) Ratio of fluorescence intensity in nuclei versus cytoplasm and plasma membrane versus cytoplasm for the constructs indicated. **, P<0.01; ***, P<0.001; one-way ANOVA. Error bars indicate s.d. Scale bar: 20 μm.